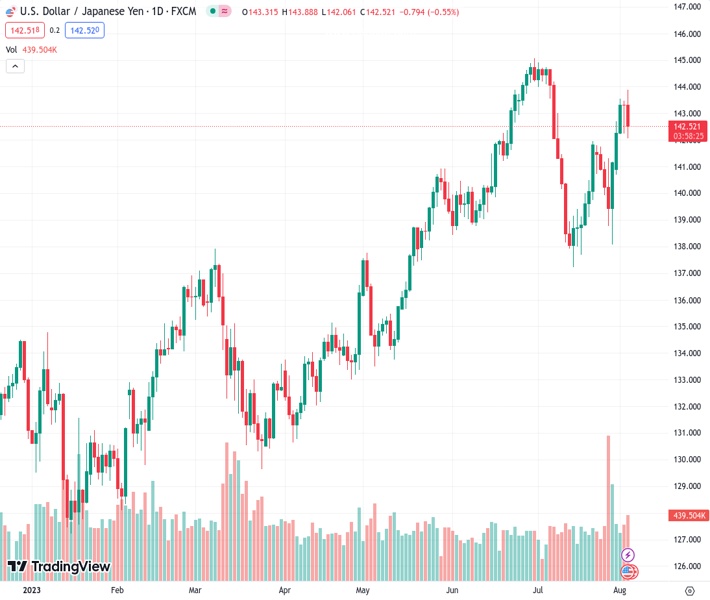
The USDJPY currency pair, currently standing at 142.517, experienced an increase to its highest level in four weeks, reaching 143.88, due to the unexpected bond purchasing intervention by the Bank of Japan (BoJ).
…
This is a premium post.
[s2If !current_user_can(access_s2member_level4)]Please register for FREE REGISTER to read full post below containing analysis. In case of any error or you think you are not able to read the full post below, please email us at support#nehcap.com [lwa][/s2If] [s2If current_user_can(access_s2member_level1)]
- USD/JPY reached a four-week high of 143.88 amid BoJ’s unscheduled bond-buying intervention.
The pair currently trades last at 142.517.
The previous day high was 143.48 while the previous day low was 142.23. The daily 38.2% Fib levels comes at 143.0, expected to provide resistance. Similarly, the daily 61.8% fib level is at 142.71, expected to provide resistance.
USD/JPY retraces after hitting a four-week high at 143.88 after the Bank of Japan (BoJ) stepped in to buy Japanese Government Bunds (JGBs) following its tweaking of the Yield Curve Control (YCC). Nevertheless, buyers’ hopes were short-lived as overall Japanese Yen (JPY) strength weighed on the USD/JPY pair. The USD/JPY exchanges hands at around 142.40s, below its opening price by approximately 0.60% in the mid-North American session.
Investors’ sentiment remains sour, as witnessed by US equities tumbling. US Treasury bond yields rise sharply, particularly the 10-year benchmark note, at 4.183%, gaining almost ten basis points, but cannot underpin the USD/JPY, as the JPY remains solid. US economic data revealed earlier showed that unemployment claims came within estimates of 227K, reported the US Department of Labor. Although the data is encouraging the labor market is easing, mixed reports in the last few months keep market participants unable to time when the jobs market would cool down.
The Institute for Supply Management (ISM) recently revealed that business services activity remains at expansionary territory at 52.7, below forecasts of 53, and trailed June’s 53.9. Even though data remains positive, it shows that activity is cooling down, putting on the table a recessionary scenario if consumers don’t support the economy.
Aside from this data, Friday’s US Nonfarm Payrolls report for July is expected to deliver a clear reading of the labor market. Any upward surprises could put on the table additional rate hikes by the US Federal Reserve (Fed). Otherwise, the Fed could take a cautious approach ahead of the September monetary policy meeting.
In the meantime, Richmond’s Fed President Thomas Barkin crossed the wires, said that inflation is too high, and that “ last month’s inflation read was a good one, and I hope it is a sign.”
On the Japanese front, the BoJ held an unscheduled bond-buying operation, as the 10-year JGB hit a high of 0.66% when the BoJ stepped into the market to buy JPY 400 billion across different maturities. Hence, Japanese Yen traders must be aware of this news, as volatility increases during the Asian session.
The USD/JPY remains upward biased but drifts toward the top of the Ichimoku Cloud (Kumo), a support area at around 142.35/45. If USD/JPY falls inside the Kumo, that could pave the way for further losses, with support levels found at the Kijun and Tenkan-Sen levels, each at 141.15 and 140.97. Conversely, if buyers reclaim 143.00, that could open the door to testing the weekly high of 143.88.
Technical Levels: Supports and Resistances
USDJPY currently trading at 142.44 at the time of writing. Pair opened at 143.33 and is trading with a change of -0.62 % .
| Overview | Overview.1 | |
|---|---|---|
| 0 | Today last price | 142.44 |
| 1 | Today Daily Change | -0.89 |
| 2 | Today Daily Change % | -0.62 |
| 3 | Today daily open | 143.33 |
The pair remains strongly bullish on the daily timeframe. It trades above its 20 SMA @ 140.73, 50 SMA 141.21, 100 SMA @ 137.7 and 200 SMA @ 136.63.
| Trends | Trends.1 | |
|---|---|---|
| 0 | Daily SMA20 | 140.73 |
| 1 | Daily SMA50 | 141.21 |
| 2 | Daily SMA100 | 137.70 |
| 3 | Daily SMA200 | 136.63 |
The previous day high was 143.48 while the previous day low was 142.23. The daily 38.2% Fib levels comes at 143.0, expected to provide resistance. Similarly, the daily 61.8% fib level is at 142.71, expected to provide resistance.
Note the levels of interest below:
- Pivot support is noted at 142.55, 141.76, 141.3
- Pivot resistance is noted at 143.8, 144.26, 145.05
| Levels | Levels.1 |
|---|---|
| Previous Daily High | 143.48 |
| Previous Daily Low | 142.23 |
| Previous Weekly High | 141.82 |
| Previous Weekly Low | 138.07 |
| Previous Monthly High | 144.91 |
| Previous Monthly Low | 137.24 |
| Daily Fibonacci 38.2% | 143.00 |
| Daily Fibonacci 61.8% | 142.71 |
| Daily Pivot Point S1 | 142.55 |
| Daily Pivot Point S2 | 141.76 |
| Daily Pivot Point S3 | 141.30 |
| Daily Pivot Point R1 | 143.80 |
| Daily Pivot Point R2 | 144.26 |
| Daily Pivot Point R3 | 145.05 |
[/s2If]
Download Nehcap EAWe have two EAs that are operational on our LIVE accounts.
- EA-FIX: Check out the details here. Download EA-FIX . EA-FIX is a non-grid HFT scalper.
- EA-GROWTH: High quality low dd EA using trend grids. Download EA_GROWTHJoin Our Telegram Group
")


