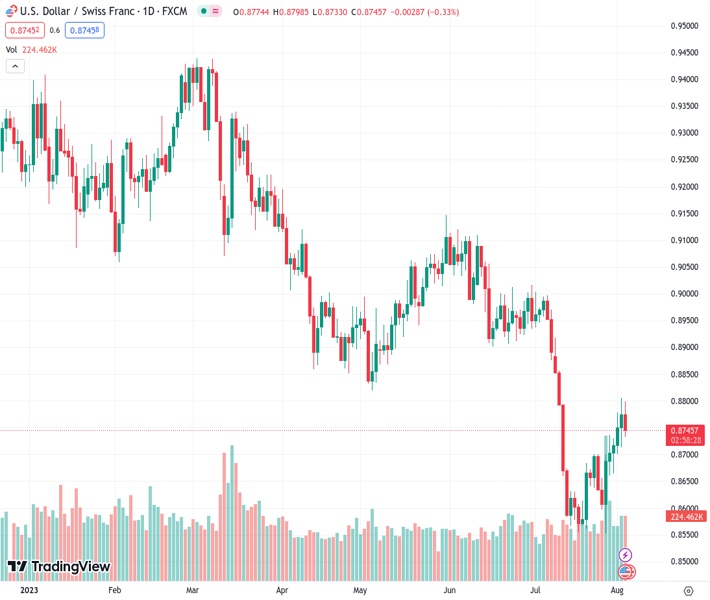
The USDCHF currency pair, currently at a rate of 0.8742, has decreased by 0.44% after reaching its highest level in four weeks at 0.87430. This drop in value for the USD comes despite the fact that Treasury bond yields are still high.
…
This is a premium post.
[s2If !current_user_can(access_s2member_level4)]Please register for FREE REGISTER to read full post below containing analysis. In case of any error or you think you are not able to read the full post below, please email us at support#nehcap.com [lwa][/s2If] [s2If current_user_can(access_s2member_level1)]
- USD/CHF retraces from four-week highs, trading at 0.8742, down 0.44% as USD dips even as Treasury bond yields remain elevated.
The pair currently trades last at 0.87430.
The previous day high was 0.8806 while the previous day low was 0.8718. The daily 38.2% Fib levels comes at 0.8772, expected to provide resistance. Similarly, the daily 61.8% fib level is at 0.8752, expected to provide resistance.
USD/CHF retraces as the US Dollar (USD) dips, despite US Treasury bond yields remaining high as market participants prepare for Friday’s US Nonfarm Payrolls report. Sentiment has shifted and is mixed, hence the greenback’s sudden weakness after hitting a new four-week high of 102.843, as shown by the US Dollar Index (DXY). At the time of writing, the USD/CHF is trading at 0.8742, down 0.44%.
From a daily chart perspective, the USD/CHF is forming a ‘bearish-harami’ two-candle chart pattern, which warrants further downside is expected, but support emerging at the 20-day Exponential Moving Average (EMA) at 0.8733, could hurt sellers’ plans for lower prices. If that scenario plays out, the USD/CHF next support to challenge would be the 38.2% Fibonacci (Fib) retracement at 0.8724, followed by the August 2 daily low of 0.8713, ahead of the 0.8700 figure.
On the other hand, if USD/CHF buyers move in, technical resistance emerges at the 50% Fib level at 0.8776, which, once cleared, will expose the current week’s high of 0.8805. A breach of the latter, the USD/CHF would rally toward the 61.8% Fib retracement at 08828.
Technical Levels: Supports and Resistances
USDCHF currently trading at 0.8749 at the time of writing. Pair opened at 0.8775 and is trading with a change of -0.3 % .
| Overview | Overview.1 | |
|---|---|---|
| 0 | Today last price | 0.8749 |
| 1 | Today Daily Change | -0.0026 |
| 2 | Today Daily Change % | -0.3000 |
| 3 | Today daily open | 0.8775 |
The pair is trading above its 20 Daily moving average @ 0.8702, below its 50 Daily moving average @ 0.8886 , below its 100 Daily moving average @ 0.8955 and below its 200 Daily moving average @ 0.9167
| Trends | Trends.1 | |
|---|---|---|
| 0 | Daily SMA20 | 0.8702 |
| 1 | Daily SMA50 | 0.8886 |
| 2 | Daily SMA100 | 0.8955 |
| 3 | Daily SMA200 | 0.9167 |
The previous day high was 0.8806 while the previous day low was 0.8718. The daily 38.2% Fib levels comes at 0.8772, expected to provide resistance. Similarly, the daily 61.8% fib level is at 0.8752, expected to provide resistance.
Note the levels of interest below:
- Pivot support is noted at 0.8727, 0.8678, 0.8639
- Pivot resistance is noted at 0.8815, 0.8854, 0.8903
| Levels | Levels.1 |
|---|---|
| Previous Daily High | 0.8806 |
| Previous Daily Low | 0.8718 |
| Previous Weekly High | 0.8737 |
| Previous Weekly Low | 0.8552 |
| Previous Monthly High | 0.9005 |
| Previous Monthly Low | 0.8552 |
| Daily Fibonacci 38.2% | 0.8772 |
| Daily Fibonacci 61.8% | 0.8752 |
| Daily Pivot Point S1 | 0.8727 |
| Daily Pivot Point S2 | 0.8678 |
| Daily Pivot Point S3 | 0.8639 |
| Daily Pivot Point R1 | 0.8815 |
| Daily Pivot Point R2 | 0.8854 |
| Daily Pivot Point R3 | 0.8903 |
[/s2If]
Download Nehcap EAWe have two EAs that are operational on our LIVE accounts.
- EA-FIX: Check out the details here. Download EA-FIX . EA-FIX is a non-grid HFT scalper.
- EA-GROWTH: High quality low dd EA using trend grids. Download EA_GROWTHJoin Our Telegram Group
")


