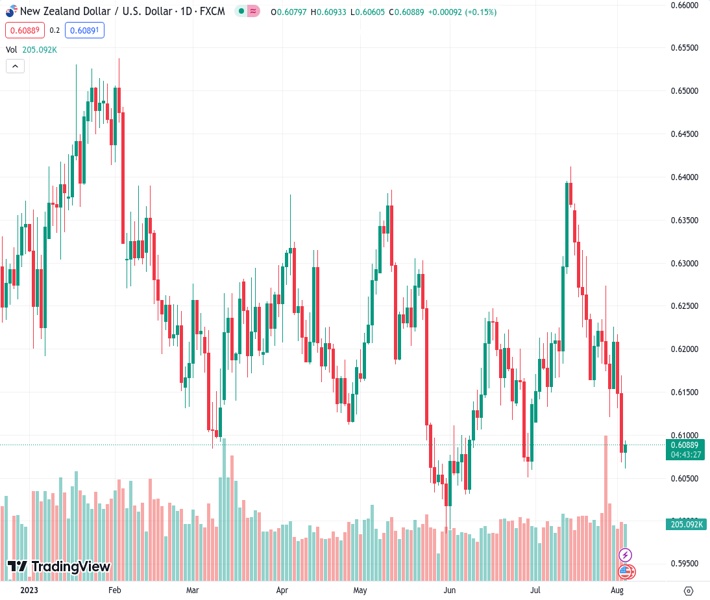
The New Zealand dollar to US dollar exchange rate increased close to the 0.6090 level after experiencing two consecutive days of decline.
…
This is a premium post.
[s2If !current_user_can(access_s2member_level4)]Please register for FREE REGISTER to read full post below containing analysis. In case of any error or you think you are not able to read the full post below, please email us at support#nehcap.com [lwa][/s2If] [s2If current_user_can(access_s2member_level1)]
- The NZD/USD rose near the 0.6090 area following two days of losses.
The pair currently trades last at 0.60887.
The previous day high was 0.6173 while the previous day low was 0.6068. The daily 38.2% Fib levels comes at 0.6108, expected to provide resistance. Similarly, the daily 61.8% fib level is at 0.6133, expected to provide resistance.
On Thursday, the NZD/USD bulls stepped up and pushed the price near the 0.6090 area. In the meantime, investors digest fresh mid-tier economic data from the US ahead of Friday’s awaited Nonfarm Payrolls (NFPs).
The Services sector from the US in July showed weakness. The S&P index came in at 52.3, lower than the consensus and previous figures of 52.4, while the Institute for Supply Management (ISM) came in at 52.7, failing to live up to the expected 53 and the last 53.9. Labor market data showed Jobless Claims slightly increasing to 227,000 at the end of July, according to expectations. Unit Labor Costs from Q2 increased by 1.6%, lower than the 2.6% expected and the previous 3.3%.
Overall, the Services sector is resilient, while the labour market flashed mixed signals during the week. Nonfarm Payrolls (NFPs) on Friday will provide investors a clearer outlook of the sector alongside wage inflation and unemployment figures.
Following the data, the DXY cleared daily gains, which saw the index peaking at 102.83 and then settling at 102.57, seesawing between small gains and losses.
With both Relative Strength Index (RSI) and Moving Average Convergence Divergence (MACD) comfortably placed in negative territory on the daily chart, the NZD/USD sellers hold the upper hand. Additionally, the pair is below the 20,100 and 200-day Simple Moving Averages (SMAs), indicating a challenging position for the buyers in the bigger picture as the bears remain in command.
Support levels: 0.6060, 0.6050, 0.6035.
Resistance levels:0.6100, 0.6130, 0.6150.
Technical Levels: Supports and Resistances
NZDUSD currently trading at 0.6085 at the time of writing. Pair opened at 0.608 and is trading with a change of 0.08 % .
| Overview | Overview.1 | |
|---|---|---|
| 0 | Today last price | 0.6085 |
| 1 | Today Daily Change | 0.0005 |
| 2 | Today Daily Change % | 0.0800 |
| 3 | Today daily open | 0.6080 |
The pair remains strongly bearish on the daily time frame. It trades below the 20 SMA @ 0.6225, 50 SMA 0.6164, 100 SMA @ 0.6196 and 200 SMA @ 0.6225.
| Trends | Trends.1 | |
|---|---|---|
| 0 | Daily SMA20 | 0.6225 |
| 1 | Daily SMA50 | 0.6164 |
| 2 | Daily SMA100 | 0.6196 |
| 3 | Daily SMA200 | 0.6225 |
The previous day high was 0.6173 while the previous day low was 0.6068. The daily 38.2% Fib levels comes at 0.6108, expected to provide resistance. Similarly, the daily 61.8% fib level is at 0.6133, expected to provide resistance.
Note the levels of interest below:
- Pivot support is noted at 0.6041, 0.6002, 0.5936
- Pivot resistance is noted at 0.6146, 0.6212, 0.6252
| Levels | Levels.1 |
|---|---|
| Previous Daily High | 0.6173 |
| Previous Daily Low | 0.6068 |
| Previous Weekly High | 0.6274 |
| Previous Weekly Low | 0.6120 |
| Previous Monthly High | 0.6413 |
| Previous Monthly Low | 0.6120 |
| Daily Fibonacci 38.2% | 0.6108 |
| Daily Fibonacci 61.8% | 0.6133 |
| Daily Pivot Point S1 | 0.6041 |
| Daily Pivot Point S2 | 0.6002 |
| Daily Pivot Point S3 | 0.5936 |
| Daily Pivot Point R1 | 0.6146 |
| Daily Pivot Point R2 | 0.6212 |
| Daily Pivot Point R3 | 0.6252 |
[/s2If]
Download Nehcap EAWe have two EAs that are operational on our LIVE accounts.
- EA-FIX: Check out the details here. Download EA-FIX . EA-FIX is a non-grid HFT scalper.
- EA-GROWTH: High quality low dd EA using trend grids. Download EA_GROWTHJoin Our Telegram Group
")


