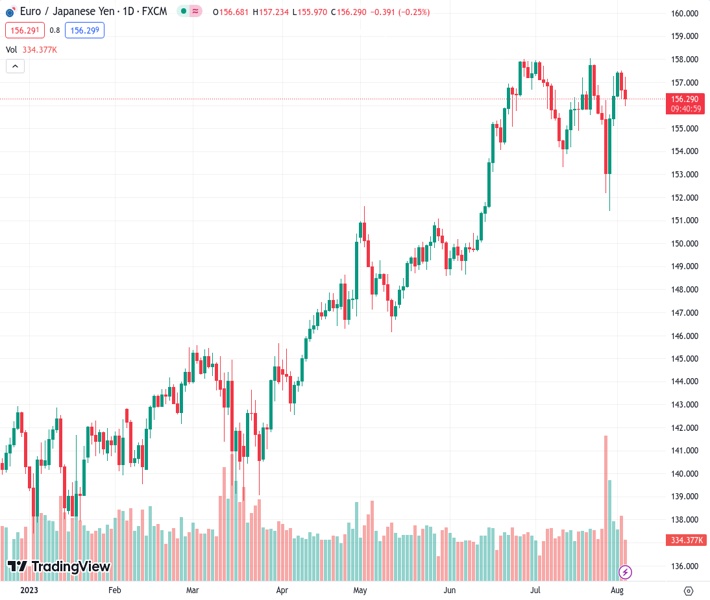
The EURJPY pair, currently at 156.300, continues its decline from Wednesday and breaks below the 156.00 level.
…
This is a premium post.
[s2If !current_user_can(access_s2member_level4)]Please register for FREE REGISTER to read full post below containing analysis. In case of any error or you think you are not able to read the full post below, please email us at support#nehcap.com [lwa][/s2If] [s2If current_user_can(access_s2member_level1)]
- EUR/JPY adds to Wednesday’s pullback and breaches 156.00.
The pair currently trades last at 156.300.
The previous day high was 157.5 while the previous day low was 156.26. The daily 38.2% Fib levels comes at 156.73, expected to provide resistance. Similarly, the daily 61.8% fib level is at 157.03, expected to provide resistance.
EUR/JPY loses ground for the second session in a row and briefly pierces the key support at 156.00 the figure on Thursday.
In case seller push harder, the cross could attempt a move to the transitory 55-day SMA near 154.00, where it is expected to meet initial contention.
Looking at the longer run, the continuation of the upside momentum appears likely with the initially target still at the 2023 high at 158.04 (July 21). The surpass of this level exposes a move to the round level of 160.00 in the not-so-distant future.
So far, the longer term positive outlook for the cross appears favoured while above the 200-day SMA, today at 146.63.
Technical Levels: Supports and Resistances
EURJPY currently trading at 156.27 at the time of writing. Pair opened at 156.77 and is trading with a change of -0.32 % .
| Overview | Overview.1 | |
|---|---|---|
| 0 | Today last price | 156.27 |
| 1 | Today Daily Change | 126.00 |
| 2 | Today Daily Change % | -0.32 |
| 3 | Today daily open | 156.77 |
The pair remains strongly bullish on the daily timeframe. It trades above its 20 SMA @ 155.83, 50 SMA 154.29, 100 SMA @ 150.27 and 200 SMA @ 146.62.
| Trends | Trends.1 | |
|---|---|---|
| 0 | Daily SMA20 | 155.83 |
| 1 | Daily SMA50 | 154.29 |
| 2 | Daily SMA100 | 150.27 |
| 3 | Daily SMA200 | 146.62 |
The previous day high was 157.5 while the previous day low was 156.26. The daily 38.2% Fib levels comes at 156.73, expected to provide resistance. Similarly, the daily 61.8% fib level is at 157.03, expected to provide resistance.
Note the levels of interest below:
- Pivot support is noted at 156.18, 155.6, 154.94
- Pivot resistance is noted at 157.43, 158.09, 158.68
| Levels | Levels.1 |
|---|---|
| Previous Daily High | 157.50 |
| Previous Daily Low | 156.26 |
| Previous Weekly High | 157.80 |
| Previous Weekly Low | 151.41 |
| Previous Monthly High | 158.05 |
| Previous Monthly Low | 151.41 |
| Daily Fibonacci 38.2% | 156.73 |
| Daily Fibonacci 61.8% | 157.03 |
| Daily Pivot Point S1 | 156.18 |
| Daily Pivot Point S2 | 155.60 |
| Daily Pivot Point S3 | 154.94 |
| Daily Pivot Point R1 | 157.43 |
| Daily Pivot Point R2 | 158.09 |
| Daily Pivot Point R3 | 158.68 |
[/s2If]
Download Nehcap EAWe have two EAs that are operational on our LIVE accounts.
- EA-FIX: Check out the details here. Download EA-FIX . EA-FIX is a non-grid HFT scalper.
- EA-GROWTH: High quality low dd EA using trend grids. Download EA_GROWTHJoin Our Telegram Group
")


