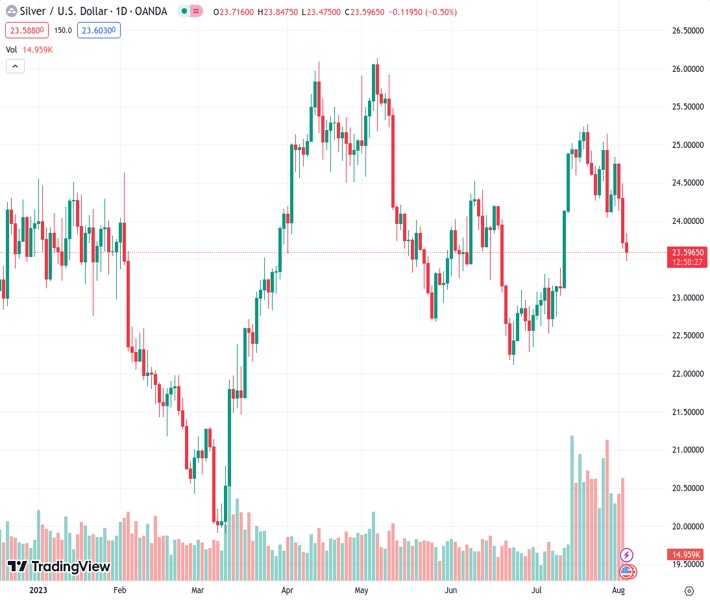
Silver has decreased in value for the third consecutive day and has now reached its lowest point in over three weeks.
…
This is a premium post.
[s2If !current_user_can(access_s2member_level4)]Please register for FREE REGISTER to read full post below containing analysis. In case of any error or you think you are not able to read the full post below, please email us at support#nehcap.com [lwa][/s2If] [s2If current_user_can(access_s2member_level1)]
- Silver drifts lower for the third successive day and drops to over a three-week low.
The pair currently trades last at 23.594.
The previous day high was 24.49 while the previous day low was 23.64. The daily 38.2% Fib levels comes at 23.97, expected to provide resistance. Similarly, the daily 61.8% fib level is at 24.17, expected to provide resistance.
Silver remains under some selling pressure for the third successive day on Thursday and drops to over a three-week low during the early part of the European session. The white metal currently trades around the $23.50-$23.45 region, down over 1% for the day, and seems vulnerable to prolonging its downward trajectory witnessed over the past two weeks or so.
The overnight breakdown below the $24.10-$24.00 confluence, comprising the 38.2% Fibonacci retracement level of the June-July rally and the 100-day Simple Moving Average (SMA), was seen as a fresh trigger for bearish traders. The subsequent slide below the 50% Fibo. level adds credence to the negative outlook and suggests that the path of least resistance for the XAG/USD is to the downside. Moreover, technical indicators on the daily chart have just started gaining negative traction and support prospects for a further near-term depreciating move.
Hence, some follow-through weakness below the 61.8% Fibo. around the $23.35 region, towards testing the next relevant support near the $23.00 round-figure mark, looks like a distinct possibility. The latter coincides with the very important 200-day SMA, which if broken decisively will make the XAG/USD vulnerable to accelerate the downfall towards the multi-month low, around the $22.15-$22.10 area touched in June.
On the flip side, attempted recovery back above the $23.70 area, or the 50% Fibo. level is more likely to attract fresh sellers and remain capped near the $24.00 strong support breakpoint, now turned resistance. A sustained strength beyond, however, might trigger a short-covering rally and lift the XAG/USD back towards the 23.6% Fibo. level, around $24.45-$24.50 supply zone. Some follow-through buying has the potential to lift Siver towards the $24.75 intermediate hurdle en route to the $25.00 psychological mark and the $25.25 resistance zone.
The latter should act as a pivotal point, above which the XAG/USD could surpass the $25.50-$25.55 resistance zone and aim to reclaim the $26.00 mark before eventually climbing to test the YTD peak, around the $26.10-$26.15 area touched in May.
Technical Levels: Supports and Resistances
XAGUSD currently trading at 23.56 at the time of writing. Pair opened at 23.73 and is trading with a change of -0.72 % .
| Overview | Overview.1 | |
|---|---|---|
| 0 | Today last price | 23.56 |
| 1 | Today Daily Change | -0.17 |
| 2 | Today Daily Change % | -0.72 |
| 3 | Today daily open | 23.73 |
The pair is trading below its 20 Daily moving average @ 24.28, below its 50 Daily moving average @ 23.7 , below its 100 Daily moving average @ 24.01 and above its 200 Daily moving average @ 23.13
| Trends | Trends.1 | |
|---|---|---|
| 0 | Daily SMA20 | 24.28 |
| 1 | Daily SMA50 | 23.70 |
| 2 | Daily SMA100 | 24.01 |
| 3 | Daily SMA200 | 23.13 |
The previous day high was 24.49 while the previous day low was 23.64. The daily 38.2% Fib levels comes at 23.97, expected to provide resistance. Similarly, the daily 61.8% fib level is at 24.17, expected to provide resistance.
Note the levels of interest below:
- Pivot support is noted at 23.42, 23.11, 22.57
- Pivot resistance is noted at 24.26, 24.8, 25.11
| Levels | Levels.1 |
|---|---|
| Previous Daily High | 24.49 |
| Previous Daily Low | 23.64 |
| Previous Weekly High | 25.15 |
| Previous Weekly Low | 24.04 |
| Previous Monthly High | 25.27 |
| Previous Monthly Low | 22.52 |
| Daily Fibonacci 38.2% | 23.97 |
| Daily Fibonacci 61.8% | 24.17 |
| Daily Pivot Point S1 | 23.42 |
| Daily Pivot Point S2 | 23.11 |
| Daily Pivot Point S3 | 22.57 |
| Daily Pivot Point R1 | 24.26 |
| Daily Pivot Point R2 | 24.80 |
| Daily Pivot Point R3 | 25.11 |
[/s2If]
Download Nehcap EAWe have two EAs that are operational on our LIVE accounts.
- EA-FIX: Check out the details here. Download EA-FIX . EA-FIX is a non-grid HFT scalper.
- EA-GROWTH: High quality low dd EA using trend grids. Download EA_GROWTHJoin Our Telegram Group
")


