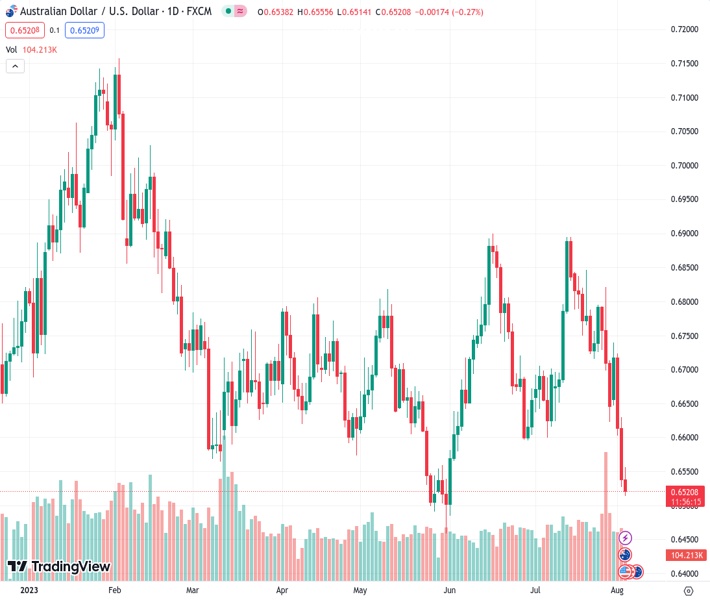
For the third consecutive day, the AUDUSD pair is falling, reaching its lowest point since early June.
…
This is a premium post.
[s2If !current_user_can(access_s2member_level4)]Please register for FREE REGISTER to read full post below containing analysis. In case of any error or you think you are not able to read the full post below, please email us at support#nehcap.com [lwa][/s2If] [s2If current_user_can(access_s2member_level1)]
- AUD/USD drifts lower for the third straiday and drops to its lowest level since early June.
The pair currently trades last at 0.65187.
The previous day high was 0.663 while the previous day low was 0.6527. The daily 38.2% Fib levels comes at 0.6566, expected to provide resistance. Similarly, the daily 61.8% fib level is at 0.6591, expected to provide resistance.
The AUD/USD pair prolongs its recent downward trajectory witnessed over the past three weeks or so and continues losing ground for the third successive day on Thursday. This also marks the sixth day of a negative move in the previous day and drags spot prices to the 0.6515 area, or the lowest level since early June during the first half of the European session.
The Australian Dollar (USD) did get a minor lift following the better-than-expected release of the Chinese Caixin Services PMI, which unexpectedly rose to 54.1 in July from 53.9 in the previous month. That said, the Australian trade balance data, showing a 2% drop in exports and a 4% decline in imports from May, pointed to cooling commodity demand in China and worsening economic conditions. This, along with the Reserve Bank of Australia’s (RBA) surprise decision to leave the cash rate unchanged earlier this week and the prevalent bullish sentiment surrounding the US Dollar (USD), prompts fresh selling around the AUD/USD pair.
In fact, the USD Index (DXY), which tracks the Greenback against a basket of currencies, touches its highest level since July 7 and remains supported by expectations for further policy tightening by the Federal Reserve (Fed). The bets were reaffirmed by the ADP report on Wednesday, which showed that private-sector employers added 324K jobs in July against the 189K estimated and pointed to continued labour market resilience. This should shield the economy from a recession, allowing the Fed to keep rates higher for longer, which pushes the yield on the benchmark 10-year US government bond to its highest level since November and underpins the buck.
The hawkish outlook, meanwhile, overshadows the Fitch downgrade of the US government’s credit rating to AA+ late Tuesday and suggests that the path of least resistance for the USD is to the upside. Furthermore, the AUD/USD pair confirmed a fresh breakdown through the 0.6600-0.6595 strong horizontal support on Wednesday, which, in turn, supports prospects for a further near-term depreciating move. Hence, a subsequent slide below the 0.6500 psychological mark, towards retesting the YTD low around the 0.6460-0.6455 region, looks like a distinct possibility ahead of the US macro data, due later during the early North American session.
Thursday’s US economic docket features the release of the usual Weekly Initial Jobless Claims, the ISM Services PMI and Factor Orders data. This, along with the US bond yields, might influence the USD price dynamics and provide some impetus to the AUD/USD pair. Traders will further take cues from the broader risk sentiment to grab short-term opportunities around the risk-sensitive Aussie. The focus, however, will remain on the closely-watched US monthly employment details, popularly known as the NFP report on Friday.
Technical Levels: Supports and Resistances
AUDUSD currently trading at 0.6518 at the time of writing. Pair opened at 0.6538 and is trading with a change of -0.31 % .
| Overview | Overview.1 | |
|---|---|---|
| 0 | Today last price | 0.6518 |
| 1 | Today Daily Change | -0.0020 |
| 2 | Today Daily Change % | -0.3100 |
| 3 | Today daily open | 0.6538 |
The pair remains strongly bearish on the daily time frame. It trades below the 20 SMA @ 0.6731, 50 SMA 0.67, 100 SMA @ 0.6692 and 200 SMA @ 0.6732.
| Trends | Trends.1 | |
|---|---|---|
| 0 | Daily SMA20 | 0.6731 |
| 1 | Daily SMA50 | 0.6700 |
| 2 | Daily SMA100 | 0.6692 |
| 3 | Daily SMA200 | 0.6732 |
The previous day high was 0.663 while the previous day low was 0.6527. The daily 38.2% Fib levels comes at 0.6566, expected to provide resistance. Similarly, the daily 61.8% fib level is at 0.6591, expected to provide resistance.
Note the levels of interest below:
- Pivot support is noted at 0.65, 0.6462, 0.6397
- Pivot resistance is noted at 0.6603, 0.6668, 0.6706
| Levels | Levels.1 |
|---|---|
| Previous Daily High | 0.6630 |
| Previous Daily Low | 0.6527 |
| Previous Weekly High | 0.6821 |
| Previous Weekly Low | 0.6623 |
| Previous Monthly High | 0.6895 |
| Previous Monthly Low | 0.6599 |
| Daily Fibonacci 38.2% | 0.6566 |
| Daily Fibonacci 61.8% | 0.6591 |
| Daily Pivot Point S1 | 0.6500 |
| Daily Pivot Point S2 | 0.6462 |
| Daily Pivot Point S3 | 0.6397 |
| Daily Pivot Point R1 | 0.6603 |
| Daily Pivot Point R2 | 0.6668 |
| Daily Pivot Point R3 | 0.6706 |
[/s2If]
Download Nehcap EAWe have two EAs that are operational on our LIVE accounts.
- EA-FIX: Check out the details here. Download EA-FIX . EA-FIX is a non-grid HFT scalper.
- EA-GROWTH: High quality low dd EA using trend grids. Download EA_GROWTHJoin Our Telegram Group
")


