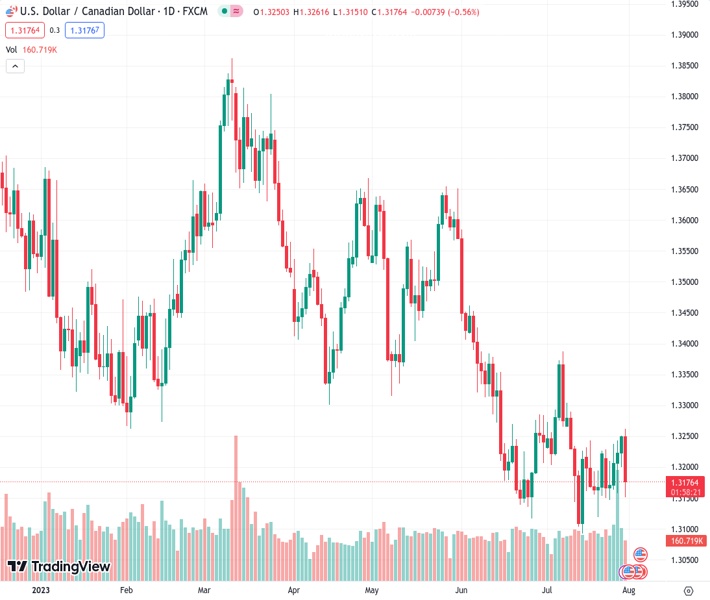
The USDCAD currency pair dropped by over 0.50% on Monday, falling below the 20-day Simple Moving Average (SMA) and reaching around the 1.3170 level.
…
This is a premium post.
[s2If !current_user_can(access_s2member_level4)]Please register for FREE REGISTER to read full post below containing analysis. In case of any error or you think you are not able to read the full post below, please email us at support#nehcap.com [lwa][/s2If] [s2If current_user_can(access_s2member_level1)]
- USD/CAD fell more than 0.50% on Monday, below the 20-day SMA towards the 1.3170 area.
The pair currently trades last at 1.31776.
The previous day high was 1.3255 while the previous day low was 1.3201. The daily 38.2% Fib levels comes at 1.3234, expected to provide resistance. Similarly, the daily 61.8% fib level is at 1.3222, expected to provide resistance.
On Monday, the USD/CAD cut a four-day winning streak and fell below the 20-day Simple Moving Average (SMA) near the 1.3170 area. A flat USD, higher Oil prices and a better market mood are responsible for the CAD’s advance. All eyes are now on US employment data to be released this week.
Regarding the next set of employment data, markets foresee a decline in job creation while maintaining wages and an unchanged unemployment rate. Since Chair Powell stated last week that the decision to set the next interest rate will only be based on new data, the direction of the US labour market will be crucial for investors to model their expectations regarding the next Fed decisions. Powell also mentioned that the banks anticipate below-trend growth and “some” labour market softening to normalise inflation.
The JOLT’s Job Opening report will be released on Tuesday, and the ADP Employment Change on Wednesday. The primary week’s highlight, the Non-Farm Payrolls (NFP) report, will be released on Friday. New unemployment claims data will be released on Thursday.
On the CAD front, the week’s highlight will be the S&P Global Manufacturing PMI from July. In the meantime, CAD’s bulls are supported by higher Oil prices as the West Texas Intermediate (WTI) barrel rose to $81.13 and the Brent to $84.88.
The USD/CAD has a bearish outlook for the short term, per the daily chart. The Relative Strength Index (RSI) and Moving Average Convergence Divergence (MACD) hint at a strong bearish momentum. Furthermore, the pair is below the 20,100 and 200-day Simple Moving Averages (SMAs), implying that the bears retain control on a broader scale.
Support levels: 1.3150, 1.3120, 1.3100.
Resistance levels: 1.3215 (20-day SMA), 1.3250, 1.3270.
Technical Levels: Supports and Resistances
USDCAD currently trading at 1.3166 at the time of writing. Pair opened at 1.3254 and is trading with a change of -0.66 % .
| Overview | Overview.1 | |
|---|---|---|
| 0 | Today last price | 1.3166 |
| 1 | Today Daily Change | -0.0088 |
| 2 | Today Daily Change % | -0.6600 |
| 3 | Today daily open | 1.3254 |
The pair remains strongly bearish on the daily time frame. It trades below the 20 SMA @ 1.3219, 50 SMA 1.3305, 100 SMA @ 1.3423 and 200 SMA @ 1.3463.
| Trends | Trends.1 | |
|---|---|---|
| 0 | Daily SMA20 | 1.3219 |
| 1 | Daily SMA50 | 1.3305 |
| 2 | Daily SMA100 | 1.3423 |
| 3 | Daily SMA200 | 1.3463 |
The previous day high was 1.3255 while the previous day low was 1.3201. The daily 38.2% Fib levels comes at 1.3234, expected to provide resistance. Similarly, the daily 61.8% fib level is at 1.3222, expected to provide resistance.
Note the levels of interest below:
- Pivot support is noted at 1.3218, 1.3183, 1.3165
- Pivot resistance is noted at 1.3272, 1.329, 1.3326
| Levels | Levels.1 |
|---|---|
| Previous Daily High | 1.3255 |
| Previous Daily Low | 1.3201 |
| Previous Weekly High | 1.3255 |
| Previous Weekly Low | 1.3147 |
| Previous Monthly High | 1.3585 |
| Previous Monthly Low | 1.3117 |
| Daily Fibonacci 38.2% | 1.3234 |
| Daily Fibonacci 61.8% | 1.3222 |
| Daily Pivot Point S1 | 1.3218 |
| Daily Pivot Point S2 | 1.3183 |
| Daily Pivot Point S3 | 1.3165 |
| Daily Pivot Point R1 | 1.3272 |
| Daily Pivot Point R2 | 1.3290 |
| Daily Pivot Point R3 | 1.3326 |
[/s2If]
Download Nehcap EAWe have two EAs that are operational on our LIVE accounts.
- EA-FIX: Check out the details here. Download EA-FIX . EA-FIX is a non-grid HFT scalper.
- EA-GROWTH: High quality low dd EA using trend grids. Download EA_GROWTHJoin Our Telegram Group
")


