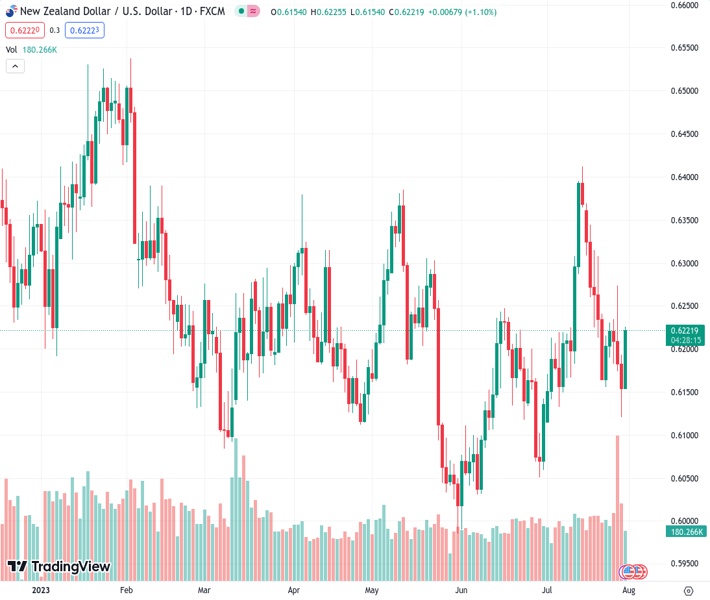
The NZDUSD currency pair surged over 1% above the 0.6200 level and is now posing a risk to surpass the 200-day simple moving average at 0.6222.
…
This is a premium post.
[s2If !current_user_can(access_s2member_level4)]Please register for FREE REGISTER to read full post below containing analysis. In case of any error or you think you are not able to read the full post below, please email us at support#nehcap.com [lwa][/s2If] [s2If current_user_can(access_s2member_level1)]
- NZD/USD jumped more than 1% above 0.6200 and threatens the 200-day SMA at 0.6222.
The pair currently trades last at 0.62220.
The previous day high was 0.6195 while the previous day low was 0.612. The daily 38.2% Fib levels comes at 0.6149, expected to provide support. Similarly, the daily 61.8% fib level is at 0.6166, expected to provide support.
On Monday, the NZD/USD gained significant ground after three consecutive days of losses jumping above the 0.6200 threshold. However, bulls need the acceptance of the 200-day Simple Moving Average at 0.6222 to continue advancing.
The United States released low-tier economic data. The US Chicago PMI for July came in slightly below expectations at 42.8 vs 43, and the Dallas Manufacturing index declined in the same month but at a somewhat lower rate than anticipated, at -20 vs -26.3.
That being said, the main highlight of the week is the Non-Farm Payrolls (NFP) report to be released on Friday. The consensus expects job creation to have decreased in July and for hourly earnings and the unemployment rate to remain stable. It’s noteworthy that Chair Powell stated last week that the next interest rate will be made solely based on new data, so the direction of the US labour market will be crucial for investors. On Tuesday, the JOLTs Job Opening will be released and on Wednesday, the economic calendar will feature the ADP employment change, followed by fresh Jobless claims data on Thursday.
In terms of the next Federal Reserve next monetary policy decisions, tightening expectations remain steady. According to World Interest Rate Possibilities (WIRP) tool, the markets are currently pricing in a 20% chance of a 25 bps hike in the September meeting and top out near 40% in the November meeting.
On the Kiwi’s side, investors will see New Zealand’s labour market data, which will be released in early Wednesday’s session.
The technical outlook for the NZD/USD, as per the daily chart, is neutral to bullish, as the indicators are recovering but still weak. The Relative Strength Index (RSI) stands below just above the midline with a positive slope, while the Moving Average Convergence Divergence (MACD) still prints red bars. On the other hand, the pair is below the 20 and 200-day Simple Moving Averages (SMA) but above the 100-day SMA, implying that the bulls remain in control on a broader scale.
Resistance levels: 0.6222 (200-day SMA),0.6230 (20-day SMA), 0.6250.
Support levels: 0.6200 (100-day SMA), 0.6180, 0.6150.
Technical Levels: Supports and Resistances
NZDUSD currently trading at 0.6219 at the time of writing. Pair opened at 0.615 and is trading with a change of 1.12 % .
| Overview | Overview.1 | |
|---|---|---|
| 0 | Today last price | 0.6219 |
| 1 | Today Daily Change | 0.0069 |
| 2 | Today Daily Change % | 1.1200 |
| 3 | Today daily open | 0.6150 |
The pair is trading below its 20 Daily moving average @ 0.6229, above its 50 Daily moving average @ 0.6168 , above its 100 Daily moving average @ 0.6198 and below its 200 Daily moving average @ 0.6219
| Trends | Trends.1 | |
|---|---|---|
| 0 | Daily SMA20 | 0.6229 |
| 1 | Daily SMA50 | 0.6168 |
| 2 | Daily SMA100 | 0.6198 |
| 3 | Daily SMA200 | 0.6219 |
The previous day high was 0.6195 while the previous day low was 0.612. The daily 38.2% Fib levels comes at 0.6149, expected to provide support. Similarly, the daily 61.8% fib level is at 0.6166, expected to provide support.
Note the levels of interest below:
- Pivot support is noted at 0.6115, 0.608, 0.604
- Pivot resistance is noted at 0.619, 0.623, 0.6265
| Levels | Levels.1 |
|---|---|
| Previous Daily High | 0.6195 |
| Previous Daily Low | 0.6120 |
| Previous Weekly High | 0.6274 |
| Previous Weekly Low | 0.6120 |
| Previous Monthly High | 0.6250 |
| Previous Monthly Low | 0.5990 |
| Daily Fibonacci 38.2% | 0.6149 |
| Daily Fibonacci 61.8% | 0.6166 |
| Daily Pivot Point S1 | 0.6115 |
| Daily Pivot Point S2 | 0.6080 |
| Daily Pivot Point S3 | 0.6040 |
| Daily Pivot Point R1 | 0.6190 |
| Daily Pivot Point R2 | 0.6230 |
| Daily Pivot Point R3 | 0.6265 |
[/s2If]
Download Nehcap EAWe have two EAs that are operational on our LIVE accounts.
- EA-FIX: Check out the details here. Download EA-FIX . EA-FIX is a non-grid HFT scalper.
- EA-GROWTH: High quality low dd EA using trend grids. Download EA_GROWTHJoin Our Telegram Group
")


