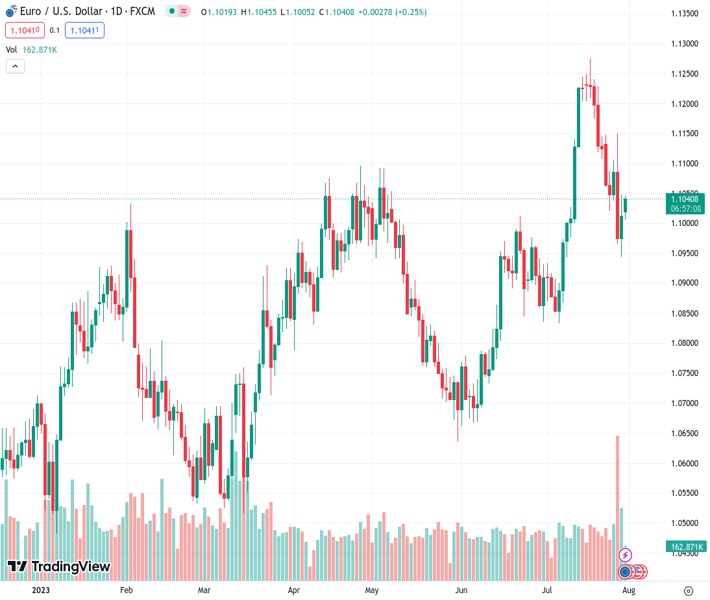
The EURUSD at 1.10400 is expected to continue gaining beyond the 1.1000 level reached on Friday.
…
This is a premium post.
[s2If !current_user_can(access_s2member_level4)]Please register for FREE REGISTER to read full post below containing analysis. In case of any error or you think you are not able to read the full post below, please email us at support#nehcap.com [lwa][/s2If] [s2If current_user_can(access_s2member_level1)]
- EUR/USD looks to add to Friday’s advance north of 1.1000.
The pair currently trades last at 1.10400.
The previous day high was 1.1048 while the previous day low was 1.0944. The daily 38.2% Fib levels comes at 1.1008, expected to provide support. Similarly, the daily 61.8% fib level is at 1.0983, expected to provide support.
EUR/USD climbs further and revisits the 1.1040 region, or daily highs, at the beginning of the week.
In light of the recent price action, the pair could see its selling pressure somewhat mitigated on a breakout of the weekly low of 1.1149 (July 27). Once this level is cleared, spot could the attempt a challenge of the 2023 top at 1.1275 (July 18).
Looking at the longer run, the positive view remains unchanged while above the 200-day SMA, today at 1.0723.
Technical Levels: Supports and Resistances
EURUSD currently trading at 1.1022 at the time of writing. Pair opened at 1.1018 and is trading with a change of 0.04 % .
| Overview | Overview.1 | |
|---|---|---|
| 0 | Today last price | 1.1022 |
| 1 | Today Daily Change | 40.0000 |
| 2 | Today Daily Change % | 0.0400 |
| 3 | Today daily open | 1.1018 |
The pair is trading below its 20 Daily moving average @ 1.1061, above its 50 Daily moving average @ 1.0915 , above its 100 Daily moving average @ 1.0905 and above its 200 Daily moving average @ 1.0719
| Trends | Trends.1 | |
|---|---|---|
| 0 | Daily SMA20 | 1.1061 |
| 1 | Daily SMA50 | 1.0915 |
| 2 | Daily SMA100 | 1.0905 |
| 3 | Daily SMA200 | 1.0719 |
The previous day high was 1.1048 while the previous day low was 1.0944. The daily 38.2% Fib levels comes at 1.1008, expected to provide support. Similarly, the daily 61.8% fib level is at 1.0983, expected to provide support.
Note the levels of interest below:
- Pivot support is noted at 1.0958, 1.0899, 1.0854
- Pivot resistance is noted at 1.1062, 1.1107, 1.1166
| Levels | Levels.1 |
|---|---|
| Previous Daily High | 1.1048 |
| Previous Daily Low | 1.0944 |
| Previous Weekly High | 1.1150 |
| Previous Weekly Low | 1.0944 |
| Previous Monthly High | 1.1012 |
| Previous Monthly Low | 1.0662 |
| Daily Fibonacci 38.2% | 1.1008 |
| Daily Fibonacci 61.8% | 1.0983 |
| Daily Pivot Point S1 | 1.0958 |
| Daily Pivot Point S2 | 1.0899 |
| Daily Pivot Point S3 | 1.0854 |
| Daily Pivot Point R1 | 1.1062 |
| Daily Pivot Point R2 | 1.1107 |
| Daily Pivot Point R3 | 1.1166 |
[/s2If]
Download Nehcap EAWe have two EAs that are operational on our LIVE accounts.
- EA-FIX: Check out the details here. Download EA-FIX . EA-FIX is a non-grid HFT scalper.
- EA-GROWTH: High quality low dd EA using trend grids. Download EA_GROWTHJoin Our Telegram Group
")


