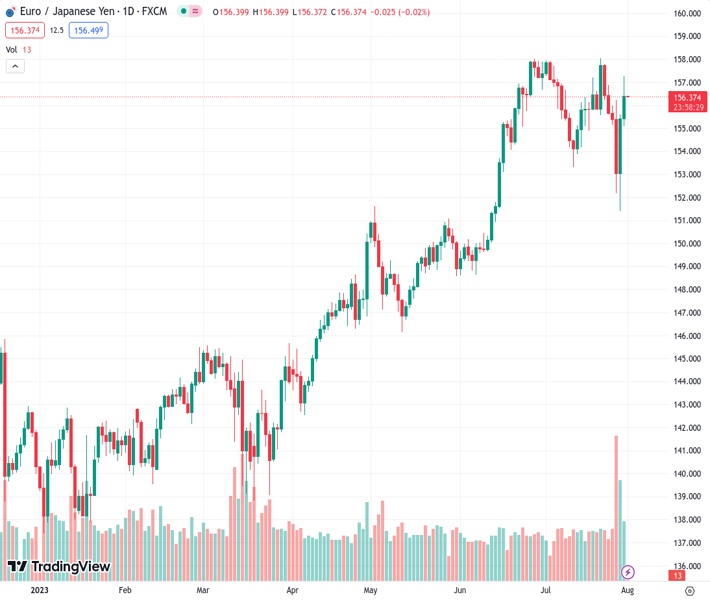
The EURJPY currency pair, at the price level of 156.450, rose significantly to a peak of 157.30 and later stabilized around 156.40.
…
This is a premium post.
[s2If !current_user_can(access_s2member_level4)]Please register for FREE REGISTER to read full post below containing analysis. In case of any error or you think you are not able to read the full post below, please email us at support#nehcap.com [lwa][/s2If] [s2If current_user_can(access_s2member_level1)]
- EUR/JPY jumped to a high of 157.30 and then settled around 156.40.
The pair currently trades last at 156.450.
The previous day high was 155.61 while the previous day low was 151.41. The daily 38.2% Fib levels comes at 154.0, expected to provide support. Similarly, the daily 61.8% fib level is at 153.01, expected to provide support.
On Monday, the EUR/JPY rose to a weekly high above 157.00 amid JPY weakness across the board. On the other hand, the EUR traded weak against most of its rivals, including the USD, AUD and GBP, on the back of falling German yields following mixed European economic activity data.
Mixed Eurozone data was reported on Monday. German Retail sales contracted but at a higher pace than expected, with the headline figures declining by 0.8% MoM in June while markets expected 0.2%. In addition, the Eurozone preliminary Q2 Gross Domestic Product (GDP) came in slightly higher than expected at 0.3% QoQ vs the 0.2% expected and the previous 0.1% contraction.
On the inflation front, the Core Index of Consumer Prices rose to 5.5% YoY in July, higher than the 5.4% expected and matching the previous 5.5% figure. In addition, the headline Harmonized Index of Consumer Prices (HICP) declined in July by 0.1%. Still, the European Central Bank (ECB) members are reported to be concerned about the sticky Core inflation, which is not retreating. Reacting to the data, German bond yields slightly decreased, which made the EUR trade with losses against most of its rivals.
On the Japanese front, the JPY continued to weaken against most of its rivals following Friday’s Bank of Japan (BoJ) dovish take. In that sense, the Japanese central banking authority stated that they would allow some flexibility in their Yield Control Curve (YCC). Still, it wasn’t a step towards normalising the monetary policy. Governor Ueda commented that the bank “was nowhere near” pivoting its dovish stance as inflation numbers are still well behind the bank’s estimates. That being said, monetary policy divergence between its peers, such as the Federal Reserve (Fed), European Central Bank (ECB), and Bank of England (BoE) should continue to weaken the Yen.
The daily charts indicate a short-term bullish momentum. The Relative Strength Index (RSI) is positioned in positive territory with an upward slope while the Moving Average Coverage Divergence (MACD) indicator shows slight fading red bards, indicating a bullish trend. On the broader look, the pair is trading above the 20,100 and 200-day Simple Moving Average (SMA), suggesting the strength of the bulls.
Resistance levels: 156.50, 157.00,157.50.
Support levels: 155.78 (20-day SMA), 155.500, 155.00.
Technical Levels: Supports and Resistances
EURJPY currently trading at 156.44 at the time of writing. Pair opened at 155.51 and is trading with a change of 0.6 % .
| Overview | Overview.1 | |
|---|---|---|
| 0 | Today last price | 156.44 |
| 1 | Today Daily Change | 0.93 |
| 2 | Today Daily Change % | 0.60 |
| 3 | Today daily open | 155.51 |
The pair remains strongly bullish on the daily timeframe. It trades above its 20 SMA @ 155.89, 50 SMA 153.85, 100 SMA @ 149.85 and 200 SMA @ 146.47.
| Trends | Trends.1 | |
|---|---|---|
| 0 | Daily SMA20 | 155.89 |
| 1 | Daily SMA50 | 153.85 |
| 2 | Daily SMA100 | 149.85 |
| 3 | Daily SMA200 | 146.47 |
The previous day high was 155.61 while the previous day low was 151.41. The daily 38.2% Fib levels comes at 154.0, expected to provide support. Similarly, the daily 61.8% fib level is at 153.01, expected to provide support.
Note the levels of interest below:
- Pivot support is noted at 152.75, 149.98, 148.55
- Pivot resistance is noted at 156.95, 158.38, 161.14
| Levels | Levels.1 |
|---|---|
| Previous Daily High | 155.61 |
| Previous Daily Low | 151.41 |
| Previous Weekly High | 157.80 |
| Previous Weekly Low | 151.41 |
| Previous Monthly High | 158.00 |
| Previous Monthly Low | 148.62 |
| Daily Fibonacci 38.2% | 154.00 |
| Daily Fibonacci 61.8% | 153.01 |
| Daily Pivot Point S1 | 152.75 |
| Daily Pivot Point S2 | 149.98 |
| Daily Pivot Point S3 | 148.55 |
| Daily Pivot Point R1 | 156.95 |
| Daily Pivot Point R2 | 158.38 |
| Daily Pivot Point R3 | 161.14 |
[/s2If]
Download Nehcap EAWe have two EAs that are operational on our LIVE accounts.
- EA-FIX: Check out the details here. Download EA-FIX . EA-FIX is a non-grid HFT scalper.
- EA-GROWTH: High quality low dd EA using trend grids. Download EA_GROWTHJoin Our Telegram Group
")


