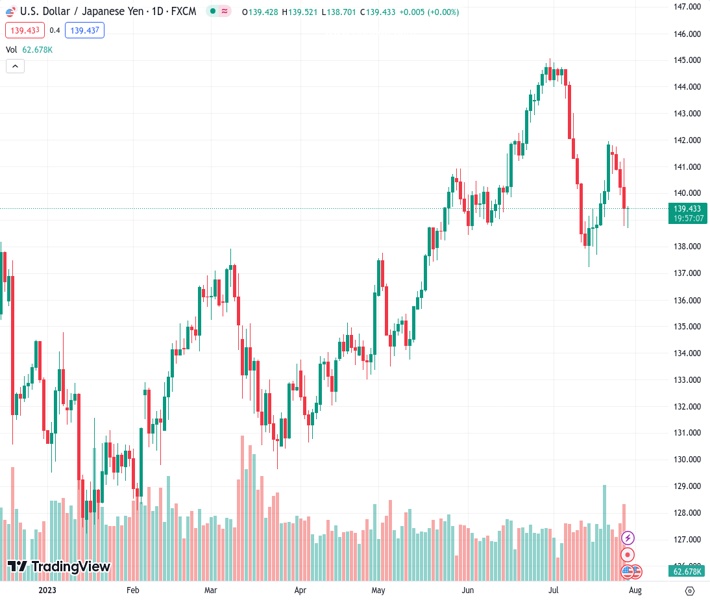
The USDJPY pair, currently valued at 139.464, is experiencing a consistent decline for the fifth consecutive day, reaching its lowest point in over a week.
…
This is a premium post.
[s2If !current_user_can(access_s2member_level4)]Please register for FREE REGISTER to read full post below containing analysis. In case of any error or you think you are not able to read the full post below, please email us at support#nehcap.com [lwa][/s2If] [s2If current_user_can(access_s2member_level1)]
- USD/JPY continues losing ground for the fifth straight day and drops to over a one-week low.
The pair currently trades last at 139.464.
The previous day high was 141.32 while the previous day low was 138.76. The daily 38.2% Fib levels comes at 139.74, expected to provide resistance. Similarly, the daily 61.8% fib level is at 140.35, expected to provide resistance.
The USD/JPY pair drifts lower for the fifth successive day and drops to a one-and-half-week low during the Asian session on Friday. Spot prices, however, manage to rebound a few pips in the last hour and climbs back above the 139.00 mark in the last hour as traders now look to the crucial Bank of Japan (BoJ) policy decision before placing fresh directional bets.
It is worth recalling that BoJ Governor Kazuo Ueda had reiterated that the central bank will stick to its accommodative monetary stance and added that the long-term yield rate remains stable under the yield curve control (YCC) policy. Investors, however, are still pricing in the possibility of a YCC tweak and the bets were lifted by stronger Tokyo CPI data for July, which remains above the BoJ’s target. This, in turn, pushes the yield on the 10-year Japanese Government Bond (JGB) above the BoJ’s tolerance band and underpins the Japanese Yen (JPY). Apart from this, a slight deterioration in the global risk sentiment benefits the JPY’s safe-haven status and contributes to the offered tone surrounding the USD/JPY pair.
The US Dollar (USD), on the other hand, sticks to the overnight strong rally to over a two-week high touched in the aftermatch of the upbeat US macro data and lends support to the USD/JPY pair. The advance estimate released by the US Commerce Department showed that the world’s largest economy grew by 2.4% annualized pace during the second quarter, beating expectations. Adding to this, the Initial Jobless Claims unexpectedly fell to 221K during the week ended July 22. This points to an extremely resilient US economy and increases the likelihood that the Federal Reserve (Fed) could further hike interest rates. In fact, the Fed on Wednesday left the door open for one more 25 bps lift-off in September or November.
Furthermore, Fed Chair Jerome Powell had said that the economy still needs to slow and the labour market to weaken for inflation to credibly return to the 2% target. This, in turn, favours the USD bulls and should help limit any further downside for the USD/JPY pair. Moreover, the aforementioned mixed fundamental backdrop might hold back traders on the sidelines heading into the key central bank event risk. Nevertheless, spot prices, at current levels, remain on track to register weekly losses, though hold comfortably above technically significant 100-day and 200-day Simple Moving Averages (SMAs).
Technical Levels: Supports and Resistances
USDJPY currently trading at 139.25 at the time of writing. Pair opened at 139.47 and is trading with a change of -0.16 % .
| Overview | Overview.1 | |
|---|---|---|
| 0 | Today last price | 139.25 |
| 1 | Today Daily Change | -0.22 |
| 2 | Today Daily Change % | -0.16 |
| 3 | Today daily open | 139.47 |
The pair is trading below its 20 Daily moving average @ 141.13, below its 50 Daily moving average @ 140.9 , above its 100 Daily moving average @ 137.35 and above its 200 Daily moving average @ 136.73
| Trends | Trends.1 | |
|---|---|---|
| 0 | Daily SMA20 | 141.13 |
| 1 | Daily SMA50 | 140.90 |
| 2 | Daily SMA100 | 137.35 |
| 3 | Daily SMA200 | 136.73 |
The previous day high was 141.32 while the previous day low was 138.76. The daily 38.2% Fib levels comes at 139.74, expected to provide resistance. Similarly, the daily 61.8% fib level is at 140.35, expected to provide resistance.
Note the levels of interest below:
- Pivot support is noted at 138.38, 137.29, 135.82
- Pivot resistance is noted at 140.94, 142.41, 143.5
| Levels | Levels.1 |
|---|---|
| Previous Daily High | 141.32 |
| Previous Daily Low | 138.76 |
| Previous Weekly High | 141.96 |
| Previous Weekly Low | 137.68 |
| Previous Monthly High | 145.07 |
| Previous Monthly Low | 138.43 |
| Daily Fibonacci 38.2% | 139.74 |
| Daily Fibonacci 61.8% | 140.35 |
| Daily Pivot Point S1 | 138.38 |
| Daily Pivot Point S2 | 137.29 |
| Daily Pivot Point S3 | 135.82 |
| Daily Pivot Point R1 | 140.94 |
| Daily Pivot Point R2 | 142.41 |
| Daily Pivot Point R3 | 143.50 |
[/s2If]
Download Nehcap EAWe have two EAs that are operational on our LIVE accounts.
- EA-FIX: Check out the details here. Download EA-FIX . EA-FIX is a non-grid HFT scalper.
- EA-GROWTH: High quality low dd EA using trend grids. Download EA_GROWTHJoin Our Telegram Group
")


