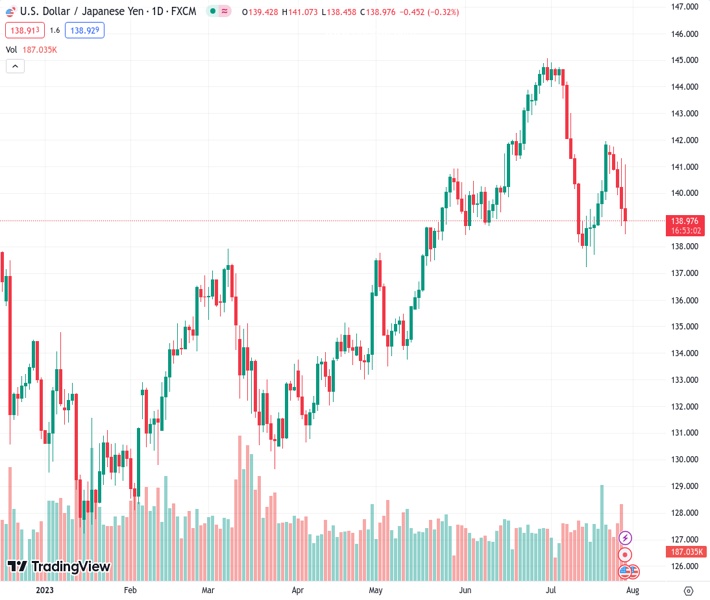
The USDJPY currency pair surged by 250 pips to 139.156 following the Bank of Japan’s decision to maintain its current Yield Curve Control (YCC) policy, dismissing speculation in the market of a potential adjustment.
…
This is a premium post.
[s2If !current_user_can(access_s2member_level4)]Please register for FREE REGISTER to read full post below containing analysis. In case of any error or you think you are not able to read the full post below, please email us at support#nehcap.com [lwa][/s2If] [s2If current_user_can(access_s2member_level1)]
- USD/JPY jumps 250 pips after BoJ rejects market’s chatters of YCC tweak with inaction.
The pair currently trades last at 139.156.
The previous day high was 141.32 while the previous day low was 138.76. The daily 38.2% Fib levels comes at 139.74, expected to provide resistance. Similarly, the daily 61.8% fib level is at 140.35, expected to provide resistance.
USD/JPY reverses the early-day fall while jumping to 141.00 round figure after the Bank of Japan (BoJ) left its monetary policy unchanged despite the market’s expectations of witnessing a tweak to the Yield Curve Control (YCC) policy.
That said, the BoJ keeps its benchmark rates near 0.10% while keeping the target of restricting the 10-year Japanese Government Bond (JGB) yields within the band of +/-0.50%.
Also read: Breaking: Bank of Japan keeps interest rate and YCC policy steady in July
Earlier in the day, the Statistics Bureau of Japan released monthly prints of the Tokyo Consumer Price Index for July. The details suggest that the headline Tokyo CPI improves to 3.2% YoY from 3.1% prior, versus 2.8% market forecasts, whereas the Tokyo CPI ex Fresh Food, Energy rises to 4.0% from 3.8% previous readings. More importantly, Tokyo CPI ex Fresh Food eases from 3.2% to 3.0% for the said month compared to analysts’ estimations of 2.9%.
Additionally, Japan Finance Minister Sunichi Suzuki also conveyed his expectations BoJ to conduct policy appropriately. On the same line were comments from Japan’s Chief Cabinet Secretary Hirokazu Matsuno, published the previous day.
It’s worth noting that the USD/JPY pair ignored a strong US Dollar rally the previous day to refresh the weekly low amid news shared via Nikkei suggesting the BoJ’s likely edit to its +/- 0.50% limit for the 10-year Japanese Government Bond (JGB) yields in monetary policy announcements. The talks of a likely change in the BoJ’s Yield Curve Control (YCC) policy propelled the JGB to the highest levels in three months after Tokyo inflation.
US Dollar Index (DXY) posted the biggest daily jump since March 15 the previous day, mostly sticky around 101.70 by the press time. That said, the DXY marked a stellar rebound from the weekly low on Thursday as the US statistics recall the Fed hawks and bolstered the Treasury bond yields.
On Thursday, the preliminary readings of the US Gross Domestic Product (GDP) Annualized for the second quarter (Q2) improved to 2.4% from 2.0% prior, versus 1.8% market forecast. On the same line, the US Durable Goods Orders also jumps 4.7% for June compared to 1.0% expected and 1.8% expected (revised). Additionally, Initial Jobless Claims declines to 221K for the week ended on July 21 versus 235K prior and analysts’ estimations of 228K. It should be observed that the US Pending Home Sales for June also improved to 0.3% MoM versus -0.5% expected and -2.5% prior (revised). However, the first estimations of the US Q2 Core Personal Consumption Expenditure eases to 3.8% QoQ from 4.9% prior and 4.0% market forecasts whereas GDP Price Index edges lower to 2.6% from 4.1% previous readings and 3.0% expected.
Apart from BoJ action and US Dollar moves, a fresh blow to the US-China ties by the White House also seems interesting to note. Late on Thursday, the Washington Post (WaPo) quotes anonymous US officials familiar with the matter to signal the White House’s readiness to stop the Hong Kong Leader from attending November’s Asia-Pacific Economic Cooperation (APEC) leaders’ summit in San Francisco.
While portraying the market’s mood, Wall Street benchmarks closed with nearly half a percent of daily losses whereas the benchmark US 10-year Treasury bond yields marked the biggest daily jump in a month to refresh a three-week high near 4.02%. However, the S&P500 Futures print mild gains and the US 10-year Treasury bond yields retreat to 3.99% by the press time.
Having witnessed the initial market reaction to the BoJ, USD/JPY traders should pay attention to BoJ Governor Kazuo Ueda’s press conference, scheduled for 06:00 AM GMT, ahead of the Fed’s favorite inflation gauge, namely the Core Personal Consumption Expenditure (PCE) Price Index for June, expected 4.2% YoY versus 4.6% prior.
Also read: PCE Inflation Preview: Price pressures set to fade in Fed favorite figures, US Dollar to follow suit
A daily closing beneath the 50% Fibonacci retracement level of October 2022 to January 2023 fall, near 139.60 by the press time, directs USD/JPY toward the horizontal area comprising multiple levels marked since December 2022, close to 138.00-137.80.
However, the RSI conditions are below and suggest bottom-picking, which in turn may challenge the bears.
Even so, the USD/JPY buyers remain off guard unless witnessing a clear upside break of the 50% Fibonacci retracement level of 139.60 and the 140.00 round figure.
Also read: USD/JPY Price Analysis: Bears occupy driver’s seat near 139.00 amid talks of BoJ’s YCC tweak
Technical Levels: Supports and Resistances
USDJPY currently trading at 139.7 at the time of writing. Pair opened at 139.47 and is trading with a change of 0.16% % .
| Overview | Overview.1 | |
|---|---|---|
| 0 | Today last price | 139.7 |
| 1 | Today Daily Change | 0.23 |
| 2 | Today Daily Change % | 0.16% |
| 3 | Today daily open | 139.47 |
The pair is trading below its 20 Daily moving average @ 141.13, below its 50 Daily moving average @ 140.9 , above its 100 Daily moving average @ 137.35 and above its 200 Daily moving average @ 136.73
| Trends | Trends.1 | |
|---|---|---|
| 0 | Daily SMA20 | 141.13 |
| 1 | Daily SMA50 | 140.90 |
| 2 | Daily SMA100 | 137.35 |
| 3 | Daily SMA200 | 136.73 |
The previous day high was 141.32 while the previous day low was 138.76. The daily 38.2% Fib levels comes at 139.74, expected to provide resistance. Similarly, the daily 61.8% fib level is at 140.35, expected to provide resistance.
Note the levels of interest below:
- Pivot support is noted at 138.38, 137.29, 135.82
- Pivot resistance is noted at 140.94, 142.41, 143.5
| Levels | Levels.1 |
|---|---|
| Previous Daily High | 141.32 |
| Previous Daily Low | 138.76 |
| Previous Weekly High | 141.96 |
| Previous Weekly Low | 137.68 |
| Previous Monthly High | 145.07 |
| Previous Monthly Low | 138.43 |
| Daily Fibonacci 38.2% | 139.74 |
| Daily Fibonacci 61.8% | 140.35 |
| Daily Pivot Point S1 | 138.38 |
| Daily Pivot Point S2 | 137.29 |
| Daily Pivot Point S3 | 135.82 |
| Daily Pivot Point R1 | 140.94 |
| Daily Pivot Point R2 | 142.41 |
| Daily Pivot Point R3 | 143.50 |
[/s2If]
Download Nehcap EAWe have two EAs that are operational on our LIVE accounts.
- EA-FIX: Check out the details here. Download EA-FIX . EA-FIX is a non-grid HFT scalper.
- EA-GROWTH: High quality low dd EA using trend grids. Download EA_GROWTHJoin Our Telegram Group
")


