The USDJPY currency pair lost its previous gains and promptly changed direction following the Bank of Japan’s policy announcement.
…
This is a premium post.
[s2If !current_user_can(access_s2member_level4)]Please register for FREE REGISTER to read full post below containing analysis. In case of any error or you think you are not able to read the full post below, please email us at support#nehcap.com [lwa][/s2If] [s2If current_user_can(access_s2member_level1)]
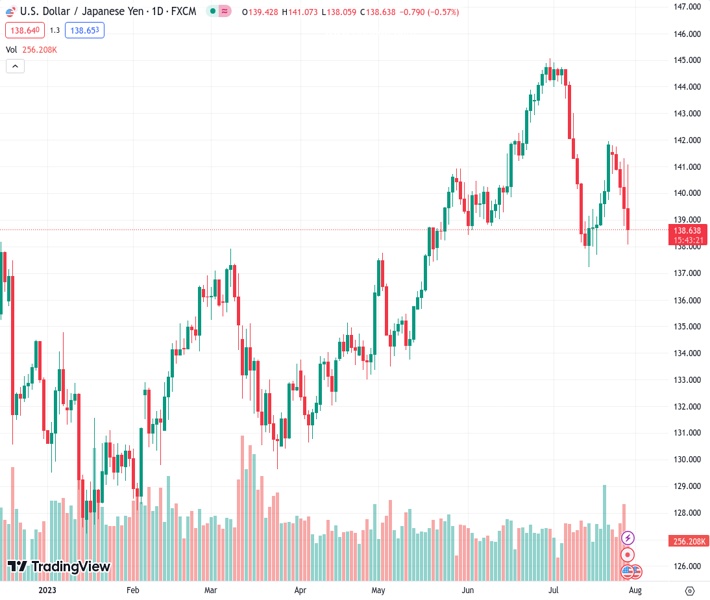
- USD/JPY shed gains and reverses quickly after the BoJ policy announcement.
The pair currently trades last at 138.623.
The previous day high was 141.32 while the previous day low was 138.76. The daily 38.2% Fib levels comes at 139.74, expected to provide resistance. Similarly, the daily 61.8% fib level is at 140.35, expected to provide resistance.
The USD/JPY pair demonstrates wild spikes after the Bank of Japan (BoJ) allows more flexibility in Japanese Government Bonds (JGBs) yields but as usual, keeps interest rates unchanged. Changing dynamics in the Japanese economy as wages and corporate earnings have increased are allowing the central bank to gradually move towards tightening monetary policy so that the Japanese yen could be safeguarded against other currencies.
Before the policy announcement, Japanese Finance Minister Shunichi Suzuki hit the wires, citing that they are “closely watching fed and other central banks’ policy decisions.” This indicates that expectations of an intervention to provide a cushion to the Japanese Yen are still open.
Meanwhile, the US Dollar Index (DXY) is juggling in a narrow range around 101.80 after a rally as the United Stated economy turned surprisingly resilient than expected.
USD/JPY is declining towards the horizontal support which is plotted from May 19 low around 137.43 on a four-hour scale. The asset has failed to sustain above the 50-period Exponential Moving Average (EMA) at 140.36, which indicates that the short-term trend is bearish.
A slippage below 40.00 by the Relative Strength Index (RSI) (14) would activate the bearish momentum.
Going forward, a decisive breakdown of May 19 low around 137.43 would expose the asset to May 16 low at 135.67 followed by May 11 low at 133.75.
In an alternate scenario, a decisive move above July 21 high at 142.00 would send the major toward July 10 high at 143.00. Breach of the latter would drive the asset towards June high at 145.07.
Technical Levels: Supports and Resistances
USDJPY currently trading at 138.77 at the time of writing. Pair opened at 139.47 and is trading with a change of -0.5 % .
| Overview | Overview.1 | |
|---|---|---|
| 0 | Today last price | 138.77 |
| 1 | Today Daily Change | -0.70 |
| 2 | Today Daily Change % | -0.50 |
| 3 | Today daily open | 139.47 |
The pair is trading below its 20 Daily moving average @ 141.13, below its 50 Daily moving average @ 140.9 , above its 100 Daily moving average @ 137.35 and above its 200 Daily moving average @ 136.73
| Trends | Trends.1 | |
|---|---|---|
| 0 | Daily SMA20 | 141.13 |
| 1 | Daily SMA50 | 140.90 |
| 2 | Daily SMA100 | 137.35 |
| 3 | Daily SMA200 | 136.73 |
The previous day high was 141.32 while the previous day low was 138.76. The daily 38.2% Fib levels comes at 139.74, expected to provide resistance. Similarly, the daily 61.8% fib level is at 140.35, expected to provide resistance.
Note the levels of interest below:
- Pivot support is noted at 138.38, 137.29, 135.82
- Pivot resistance is noted at 140.94, 142.41, 143.5
| Levels | Levels.1 |
|---|---|
| Previous Daily High | 141.32 |
| Previous Daily Low | 138.76 |
| Previous Weekly High | 141.96 |
| Previous Weekly Low | 137.68 |
| Previous Monthly High | 145.07 |
| Previous Monthly Low | 138.43 |
| Daily Fibonacci 38.2% | 139.74 |
| Daily Fibonacci 61.8% | 140.35 |
| Daily Pivot Point S1 | 138.38 |
| Daily Pivot Point S2 | 137.29 |
| Daily Pivot Point S3 | 135.82 |
| Daily Pivot Point R1 | 140.94 |
| Daily Pivot Point R2 | 142.41 |
| Daily Pivot Point R3 | 143.50 |
[/s2If]
Download Nehcap EAWe have two EAs that are operational on our LIVE accounts.
- EA-FIX: Check out the details here. Download EA-FIX . EA-FIX is a non-grid HFT scalper.
- EA-GROWTH: High quality low dd EA using trend grids. Download EA_GROWTHJoin Our Telegram Group
")


