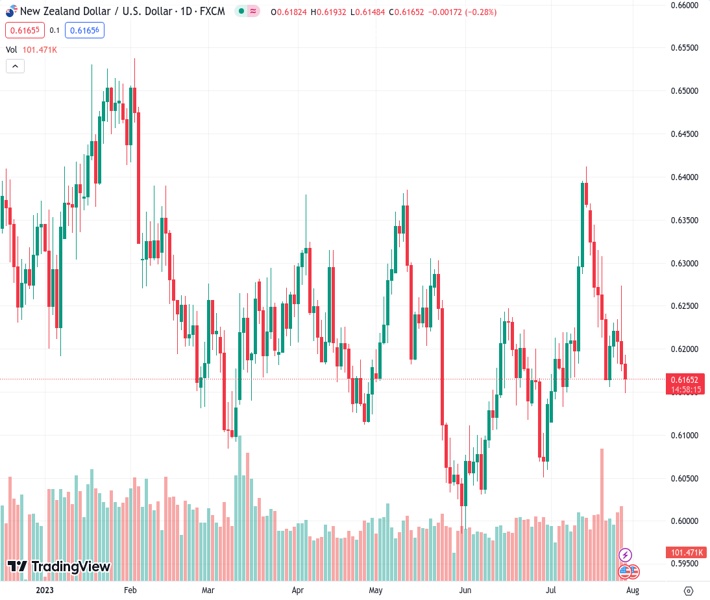
The NZDUSD pair, currently trading at 0.61664, continues to experience downward pressure, reaching its lowest level in three weeks. This decline marks the third consecutive day of losses. According to the analysis by @nehcap, it is anticipated that the pair will face further declines in the future.
…
This is a premium post.
[s2If !current_user_can(access_s2member_level4)]Please register for FREE REGISTER to read full post below containing analysis. In case of any error or you think you are not able to read the full post below, please email us at support#nehcap.com [lwa][/s2If] [s2If current_user_can(access_s2member_level1)]
- NZD/USD stays pressured at the lowest level in three weeks, down for the third consecutive day.
The pair currently trades last at 0.61664.
The previous day high was 0.6274 while the previous day low was 0.6174. The daily 38.2% Fib levels comes at 0.6212, expected to provide resistance. Similarly, the daily 61.8% fib level is at 0.6236, expected to provide resistance.
NZD/USD remains depressed at the lowest level in three weeks, down half a percent near 0.6155 heading into Friday’s European session. In doing so, the Kiwi pair drops for the third consecutive day while justifying the downside break of the 200-SMA and an upward-sloping trend line from July 06.
It’s worth noting, however, that the market’s cautious mood ahead of the Fed’s favorite inflation gauge, namely the Core Personal Consumption Expenditure (PCE) Price Index for June, expected 4.2% YoY versus 4.6% prior, restricts the NZD/USD pair’s immediate fall.
Also limiting the Kiwi pair’s further downside is the oversold RSI and the 61.8% Fibonacci retracement level of its upside from late May to mid-July, close to 0.6150.
Even if the quote breaks the key Fibonacci retracement level surrounding 0.6150, often termed the golden Fibonacci ratio, the NZD/USD pair’s slump isn’t guaranteed as an ascending support line from late May, close to 0.6115, will act as the final defense of the bulls.
Meanwhile, NZD/USD recovery remains elusive below the three-week-long support-turned-resistance line, around 0.6180 by the press time.
Following that, the 200-SMA level of around 0.6205 and the weekly high surrounding 0.6275 could check the Kiwi pair buyers before giving them control.
Trend: Further downside expected
Technical Levels: Supports and Resistances
NZDUSD currently trading at 0.6157 at the time of writing. Pair opened at 0.6183 and is trading with a change of -0.42% % .
| Overview | Overview.1 | |
|---|---|---|
| 0 | Today last price | 0.6157 |
| 1 | Today Daily Change | -0.0026 |
| 2 | Today Daily Change % | -0.42% |
| 3 | Today daily open | 0.6183 |
The pair remains strongly bearish on the daily time frame. It trades below the 20 SMA @ 0.6227, 50 SMA 0.6167, 100 SMA @ 0.6198 and 200 SMA @ 0.6217.
| Trends | Trends.1 | |
|---|---|---|
| 0 | Daily SMA20 | 0.6227 |
| 1 | Daily SMA50 | 0.6167 |
| 2 | Daily SMA100 | 0.6198 |
| 3 | Daily SMA200 | 0.6217 |
The previous day high was 0.6274 while the previous day low was 0.6174. The daily 38.2% Fib levels comes at 0.6212, expected to provide resistance. Similarly, the daily 61.8% fib level is at 0.6236, expected to provide resistance.
Note the levels of interest below:
- Pivot support is noted at 0.6147, 0.611, 0.6047
- Pivot resistance is noted at 0.6247, 0.631, 0.6347
| Levels | Levels.1 |
|---|---|
| Previous Daily High | 0.6274 |
| Previous Daily Low | 0.6174 |
| Previous Weekly High | 0.6370 |
| Previous Weekly Low | 0.6163 |
| Previous Monthly High | 0.6250 |
| Previous Monthly Low | 0.5990 |
| Daily Fibonacci 38.2% | 0.6212 |
| Daily Fibonacci 61.8% | 0.6236 |
| Daily Pivot Point S1 | 0.6147 |
| Daily Pivot Point S2 | 0.6110 |
| Daily Pivot Point S3 | 0.6047 |
| Daily Pivot Point R1 | 0.6247 |
| Daily Pivot Point R2 | 0.6310 |
| Daily Pivot Point R3 | 0.6347 |
[/s2If]
Download Nehcap EAWe have two EAs that are operational on our LIVE accounts.
- EA-FIX: Check out the details here. Download EA-FIX . EA-FIX is a non-grid HFT scalper.
- EA-GROWTH: High quality low dd EA using trend grids. Download EA_GROWTHJoin Our Telegram Group
")


