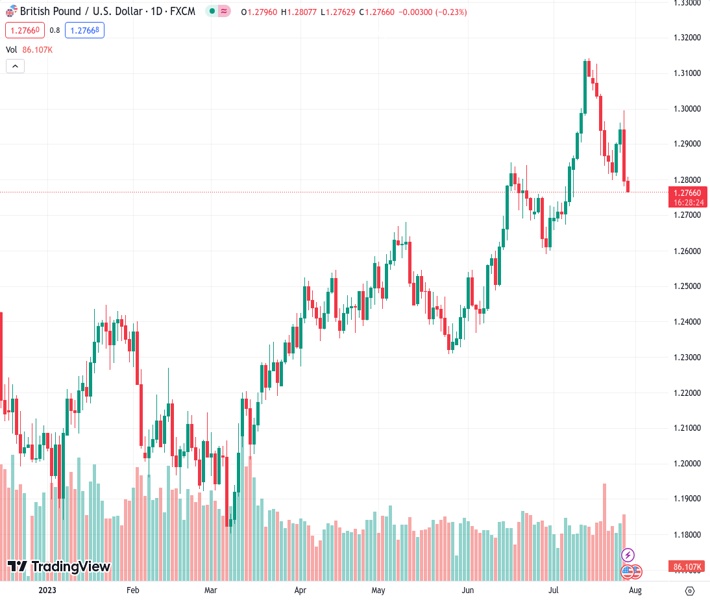
The GBPUSD pair, currently at 1.27670, extends its decline from the previous day and falls to a level not seen in almost three weeks on Friday.
…
This is a premium post.
[s2If !current_user_can(access_s2member_level4)]Please register for FREE REGISTER to read full post below containing analysis. In case of any error or you think you are not able to read the full post below, please email us at support#nehcap.com [lwa][/s2If] [s2If current_user_can(access_s2member_level1)]
- GBP/USD adds to the overnight losses and drops t a nearly three-week low on Friday.
The pair currently trades last at 1.27670.
The previous day high was 1.2996 while the previous day low was 1.2782. The daily 38.2% Fib levels comes at 1.2864, expected to provide resistance. Similarly, the daily 61.8% fib level is at 1.2914, expected to provide resistance.
The GBP/USD pair remains depressed for the second successive day on Friday and touches a nearly three-week low, around the 1.2765 region during the Asian session.
The US Dollar (USD) builds on the previous day’s strong rally from a one-week low and climbs to its highest level since July 10, which, in turn, is seen as a key factor exerting some pressure on the GBP/USD pair. Thursday’s upbeat US macro data pointed to an extremely resilient US economy and increased the likelihood that the Federal Reserve (Fed) could further hike interest rates. The US Commerce Department reported that the world’s largest economy expanded by 2.4% annualized pace during the April-June quarter, beating expectations. Adding to this, the Initial Jobless Claims unexpectedly fell to 221K in the week ended July 22.
This comes after Fed Chair Jerome Powell left the door open for one more 25 bps rate-hike in September or November by saying that the economy still needs to slow and the labour market to weaken for inflation to credibly return to the 2% target. The outlook remains supportive of a further rise in the US Treasury bond yields. In fact, the yield on the yield on the benchmark 10-year US government bond climbs back above the 4.0% threshold, which, along with a slight deterioration in the global risk sentiment, benefits the Greenback’s relative safe-haven stats and contributes to the selling bias surrounding the GBP/USD pair.
Friday’s downfall, meanwhile, could further be attributed to some technical selling following the overnight sustained break and close below a two-month-old ascending trend-line support. Apart from this, diminishing odds for aggressive rate hikes by the Bank of England (BoE), especially after the softer UK consumer inflation figures released last week, suggests that the path of least resistance for the GBP/USD pair is to the downside. Market participants now look forward to the release of the US Core PCE Price Index – the Fed’s preferred inflation gauge – for some meaningful impetus later during the early North American session.
Technical Levels: Supports and Resistances
GBPUSD currently trading at 1.2774 at the time of writing. Pair opened at 1.2796 and is trading with a change of -0.17 % .
| Overview | Overview.1 | |
|---|---|---|
| 0 | Today last price | 1.2774 |
| 1 | Today Daily Change | -0.0022 |
| 2 | Today Daily Change % | -0.1700 |
| 3 | Today daily open | 1.2796 |
The pair is trading below its 20 Daily moving average @ 1.2882, above its 50 Daily moving average @ 1.269 , above its 100 Daily moving average @ 1.2546 and above its 200 Daily moving average @ 1.2278
| Trends | Trends.1 | |
|---|---|---|
| 0 | Daily SMA20 | 1.2882 |
| 1 | Daily SMA50 | 1.2690 |
| 2 | Daily SMA100 | 1.2546 |
| 3 | Daily SMA200 | 1.2278 |
The previous day high was 1.2996 while the previous day low was 1.2782. The daily 38.2% Fib levels comes at 1.2864, expected to provide resistance. Similarly, the daily 61.8% fib level is at 1.2914, expected to provide resistance.
Note the levels of interest below:
- Pivot support is noted at 1.272, 1.2644, 1.2506
- Pivot resistance is noted at 1.2934, 1.3072, 1.3148
| Levels | Levels.1 |
|---|---|
| Previous Daily High | 1.2996 |
| Previous Daily Low | 1.2782 |
| Previous Weekly High | 1.3126 |
| Previous Weekly Low | 1.2816 |
| Previous Monthly High | 1.2848 |
| Previous Monthly Low | 1.2369 |
| Daily Fibonacci 38.2% | 1.2864 |
| Daily Fibonacci 61.8% | 1.2914 |
| Daily Pivot Point S1 | 1.2720 |
| Daily Pivot Point S2 | 1.2644 |
| Daily Pivot Point S3 | 1.2506 |
| Daily Pivot Point R1 | 1.2934 |
| Daily Pivot Point R2 | 1.3072 |
| Daily Pivot Point R3 | 1.3148 |
[/s2If]
Download Nehcap EAWe have two EAs that are operational on our LIVE accounts.
- EA-FIX: Check out the details here. Download EA-FIX . EA-FIX is a non-grid HFT scalper.
- EA-GROWTH: High quality low dd EA using trend grids. Download EA_GROWTHJoin Our Telegram Group
")


