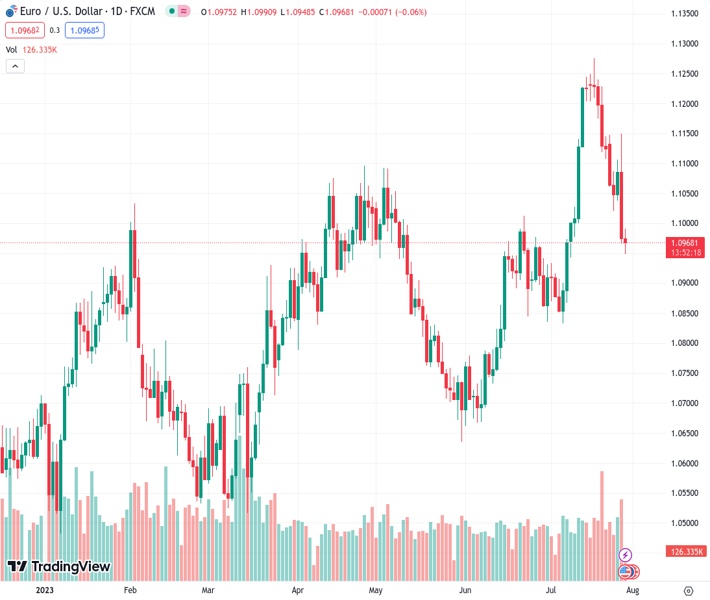
The EURUSD pair, currently valued at 1.09752, remains unchanged at its lowest point in the past three weeks as investors anticipate crucial inflation information from Germany and the United States.
…
This is a premium post.
[s2If !current_user_can(access_s2member_level4)]Please register for FREE REGISTER to read full post below containing analysis. In case of any error or you think you are not able to read the full post below, please email us at support#nehcap.com [lwa][/s2If] [s2If current_user_can(access_s2member_level1)]
- EUR/USD remains sidelined at the lowest level in three weeks as market await the key inflation data from Germany, US.
The pair currently trades last at 1.09752.
The previous day high was 1.115 while the previous day low was 1.0966. The daily 38.2% Fib levels comes at 1.1036, expected to provide resistance. Similarly, the daily 61.8% fib level is at 1.1079, expected to provide resistance.
EUR/USD licks its wounds at the lowest levels in three weeks, picking up bids to 1.0985 amid the early hours of Friday’s European session. In doing so, the Euro pair portrays the positioning for the top-tier inflation clues from Germany and the US amid sluggish markets.
The major currency pair slumped the most in four months the previous day after the European Central Bank (ECB) failed to impress the Euro bulls despite announcing 25 basis points (bps) increase in the benchmark rates. That said, the policy statement showed the board is “open-minded” about further tightening.
The reason could be linked to an edit in the ECB Statement and President Christine Lagarde’s comments stating, “The wording change in the statement was not random or irrelevant.”
That said, the recently positive mood in the market, amid hopes of a sooner end to the restrictive monetary policies at major central banks, seems to weigh on the US Dollar and allow the EUR/USD to print a corrective bounce.
The US Dollar’s retreat from a three-week high also allows the major currency pair to consolidate the weekly losses. That said, the US Dollar Index (DXY) prints mild losses around 101.70 after rising to the highest since July 11 during the previous day’s heavy run-up. It’s worth noting that the greenback’s gauge versus the six major currencies jumped the most since March 15 the previous day, not to forget mentioning a stellar rebound from the weekly low, as the US statistics recall the Fed hawks and bolstered the Treasury bond yields. Among the major positives for the DXY were the preliminary readings of the US Gross Domestic Product (GDP) Annualized for the second quarter (Q2) and the Durable Goods orders for June.
Amid these plays, Wall Street benchmarks closed with nearly half a percent of daily losses whereas the benchmark US 10-year Treasury bond yields marked the biggest daily jump in a month to refresh a three-week high near 4.02%. However, the S&P500 Futures print mild gains and the US 10-year Treasury bond yields retreat to 3.99% by the press time.
Moving on, the first prints of the German GDP and inflation clues will precede the Fed’s favorite inflation gauge, namely the Core Personal Consumption Expenditure (PCE) Price Index for June, to entertain the EUR/USD moves. In a case where the German data amplifies recession concerns and softer inflation, the Euro won’t hesitate to refresh the multi-day low. However, the downside also depends on how strong the US inflation clues are.
The 50-day Exponential Moving Average (EMA) and a two-month-old rising support line, respectively near 1.0970 and 1.0955, restrict the EUR/USD pair’s immediate downside. Alternatively, recovery moves remain elusive unless providing a clear upside break of a five-week-old horizontal resistance surrounding 1.1010-20.
Technical Levels: Supports and Resistances
EURUSD currently trading at 1.0981 at the time of writing. Pair opened at 1.0978 and is trading with a change of 0.03% % .
| Overview | Overview.1 | |
|---|---|---|
| 0 | Today last price | 1.0981 |
| 1 | Today Daily Change | 0.0003 |
| 2 | Today Daily Change % | 0.03% |
| 3 | Today daily open | 1.0978 |
The pair is trading below its 20 Daily moving average @ 1.1055, above its 50 Daily moving average @ 1.091 , above its 100 Daily moving average @ 1.0901 and above its 200 Daily moving average @ 1.0714
| Trends | Trends.1 | |
|---|---|---|
| 0 | Daily SMA20 | 1.1055 |
| 1 | Daily SMA50 | 1.0910 |
| 2 | Daily SMA100 | 1.0901 |
| 3 | Daily SMA200 | 1.0714 |
The previous day high was 1.115 while the previous day low was 1.0966. The daily 38.2% Fib levels comes at 1.1036, expected to provide resistance. Similarly, the daily 61.8% fib level is at 1.1079, expected to provide resistance.
Note the levels of interest below:
- Pivot support is noted at 1.0913, 1.0847, 1.0729
- Pivot resistance is noted at 1.1097, 1.1215, 1.1281
| Levels | Levels.1 |
|---|---|
| Previous Daily High | 1.1150 |
| Previous Daily Low | 1.0966 |
| Previous Weekly High | 1.1276 |
| Previous Weekly Low | 1.1108 |
| Previous Monthly High | 1.1012 |
| Previous Monthly Low | 1.0662 |
| Daily Fibonacci 38.2% | 1.1036 |
| Daily Fibonacci 61.8% | 1.1079 |
| Daily Pivot Point S1 | 1.0913 |
| Daily Pivot Point S2 | 1.0847 |
| Daily Pivot Point S3 | 1.0729 |
| Daily Pivot Point R1 | 1.1097 |
| Daily Pivot Point R2 | 1.1215 |
| Daily Pivot Point R3 | 1.1281 |
[/s2If]
Download Nehcap EAWe have two EAs that are operational on our LIVE accounts.
- EA-FIX: Check out the details here. Download EA-FIX . EA-FIX is a non-grid HFT scalper.
- EA-GROWTH: High quality low dd EA using trend grids. Download EA_GROWTHJoin Our Telegram Group
")


