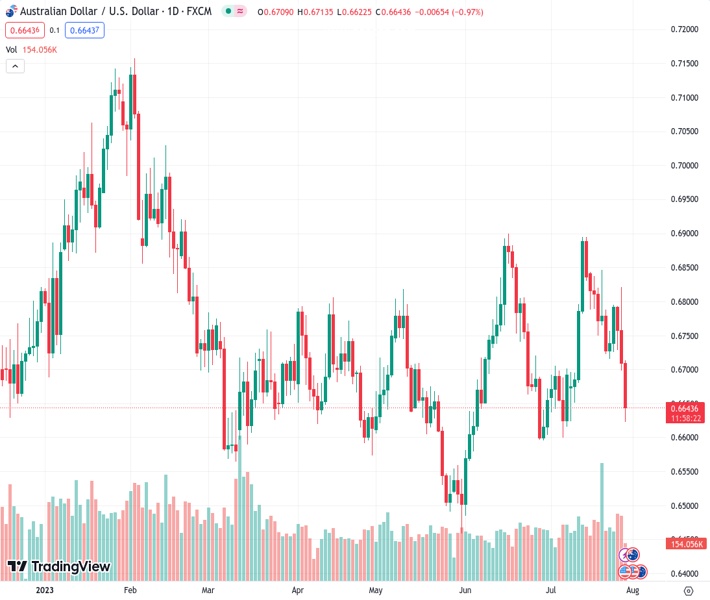
The currency pair AUDUSD, currently valued at 0.66425, experiences further decline on Friday and reaches its lowest point in almost three weeks.
…
This is a premium post.
[s2If !current_user_can(access_s2member_level4)]Please register for FREE REGISTER to read full post below containing analysis. In case of any error or you think you are not able to read the full post below, please email us at support#nehcap.com [lwa][/s2If] [s2If current_user_can(access_s2member_level1)]
- AUD/USD continues losing ground on Friday and drops to a nearly three-week low.
The pair currently trades last at 0.66425.
The previous day high was 0.6821 while the previous day low was 0.6698. The daily 38.2% Fib levels comes at 0.6745, expected to provide resistance. Similarly, the daily 61.8% fib level is at 0.6774, expected to provide resistance.
The AUD/USD pair extends the previous day’s sharp retracement slide from the 0.6820 region and remains under heavy selling pressure on Friday, or the third successive day. The downward trajectory remains uninterrupted through the first half of the European session and drags spot prices to a nearly three-week low, around the 0.6620 region in the last hour.
The US Dollar (USD) gains some follow-through traction on the last day of the week and climbs to its highest level since July 10, which, in turn, is seen weighing on the AUD/USD pair. The stronger US macro data released on Friday – the Advance Q2 GDP print and Weekly Initial Jobless Claims – pointed to an extremely resilient US economy and increased the likelihood that the Federal Reserve (Fed) could hike interest rates further. It is worth recalling that Fed Chair Jerome Powell said on Wednesday that the economy still needs to slow and the labour market to weaken for inflation to credibly return to the 2% target.
This keeps the door for one more 25 bps rate-hike in September or November wide open and remains supportive of a further rise in the US Treasury bond yields. In fact, the yield on the yield on the benchmark 10-year US government bond climbs back above the 4.0% threshold and continues to underpin the Greenback. Adding to this, the worsening US-China relations overshadow the stronger Australian CPI print released on Thursday and drive flows away from the China-proxy Aussie. This, along with technical selling below the 200-day Simple Moving Average (SMA) contributes to the AUD/USD pair’s downward trajectory.
That said, it will still be prudent to wait for some follow-through selling and acceptance below the 0.6600 mark before traders start positioning for an extension of the recent rejection slide from the 0.6900 neighbourhood. Market participants now look to the release of the US Core PCE Price Index – the Fed’s preferred inflation gauge – for a fresh impetus later during the early North American session. The data might influence market expectations about the Fed’s next policy move, which, along with the broader risk sentiment, should drive the USD demand and produce short-term trading opportunities around the AUD/USD pair.
Technical Levels: Supports and Resistances
AUDUSD currently trading at 0.6642 at the time of writing. Pair opened at 0.6709 and is trading with a change of -1.0 % .
| Overview | Overview.1 | |
|---|---|---|
| 0 | Today last price | 0.6642 |
| 1 | Today Daily Change | -0.0067 |
| 2 | Today Daily Change % | -1.0000 |
| 3 | Today daily open | 0.6709 |
The pair remains strongly bearish on the daily time frame. It trades below the 20 SMA @ 0.6739, 50 SMA 0.6698, 100 SMA @ 0.6692 and 200 SMA @ 0.6727.
| Trends | Trends.1 | |
|---|---|---|
| 0 | Daily SMA20 | 0.6739 |
| 1 | Daily SMA50 | 0.6698 |
| 2 | Daily SMA100 | 0.6692 |
| 3 | Daily SMA200 | 0.6727 |
The previous day high was 0.6821 while the previous day low was 0.6698. The daily 38.2% Fib levels comes at 0.6745, expected to provide resistance. Similarly, the daily 61.8% fib level is at 0.6774, expected to provide resistance.
Note the levels of interest below:
- Pivot support is noted at 0.6665, 0.662, 0.6542
- Pivot resistance is noted at 0.6788, 0.6866, 0.6911
| Levels | Levels.1 |
|---|---|
| Previous Daily High | 0.6821 |
| Previous Daily Low | 0.6698 |
| Previous Weekly High | 0.6854 |
| Previous Weekly Low | 0.6722 |
| Previous Monthly High | 0.6900 |
| Previous Monthly Low | 0.6484 |
| Daily Fibonacci 38.2% | 0.6745 |
| Daily Fibonacci 61.8% | 0.6774 |
| Daily Pivot Point S1 | 0.6665 |
| Daily Pivot Point S2 | 0.6620 |
| Daily Pivot Point S3 | 0.6542 |
| Daily Pivot Point R1 | 0.6788 |
| Daily Pivot Point R2 | 0.6866 |
| Daily Pivot Point R3 | 0.6911 |
[/s2If]
Download Nehcap EAWe have two EAs that are operational on our LIVE accounts.
- EA-FIX: Check out the details here. Download EA-FIX . EA-FIX is a non-grid HFT scalper.
- EA-GROWTH: High quality low dd EA using trend grids. Download EA_GROWTHJoin Our Telegram Group
")


