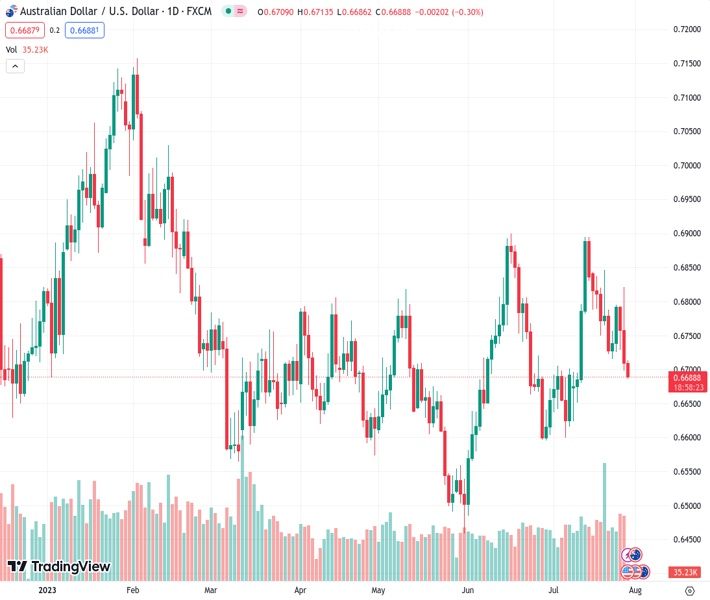
The Australian dollar against the US dollar, at a value of 0.66913, experiences a decline to its lowest point in more than two weeks due to the influence of multiple factors.
…
This is a premium post.
[s2If !current_user_can(access_s2member_level4)]Please register for FREE REGISTER to read full post below containing analysis. In case of any error or you think you are not able to read the full post below, please email us at support#nehcap.com [lwa][/s2If] [s2If current_user_can(access_s2member_level1)]
- AUD/USD drops to over a two-week low and is pressured by a combination of factors.
The pair currently trades last at 0.66913.
The previous day high was 0.6821 while the previous day low was 0.6698. The daily 38.2% Fib levels comes at 0.6745, expected to provide resistance. Similarly, the daily 61.8% fib level is at 0.6774, expected to provide resistance.
The AUD/USD pair extended the previous day’s sharp retracement slide of over 120 pips from the weekly top and continues losing ground through the Asian session on Friday. This marks the third straight day of a negative move and drags spot prices to over a two-week low, below the 0.6700 mark in the last hour, confirming a breakdown below a technically significant 200-day Simple Moving Average (SMA).
The US Dollar (USD) stands tall near a two-and-half-week top touched and remains well supported by Thursday’s upbeat US macro data, which, in turn, is seen exerting downward pressure on the AUD/USD pair. The US Commerce Department reported that the world’s largest economy expanded by 2.4% annualized pace during the second quarter, beating expectations. Adding to this, the Initial Jobless Claims unexpectedly fell to 221K during the week ended July 22, pointing to an extremely resilient US economy. This increases the likelihood that the Federal Reserve (Fed) could further hike interest rates and continues to underpin the buck.
Moreover, Fed Chair Jerome Powell on Wednesday said that the economy still needs to slow and the labour market to weaken for inflation to credibly return to the 2% target, leaving the door open for one more 25 bps rate-hike in September or November. This led to the overnight sharp rise in the US Treasury bond yields, which, along with a slight deterioration in the global risk sentiment, benefits the Greenback’s relative safe-haven status. Apart from this, the worsening US-China relations overshadow the stronger Australian CPI report released on Thursday and further contribute to driving flows away from the China-proxy Aussie.
In fact, the Washington Post, citing three officials familiar with the matter, reported that the White House has decided it will bar Hong Kong’s top government official from attending a major economic summit in the US this fall. In response, a spokesman for the Chinese Embassy in Washington, Liu Pengyu, said that the decision violates the APEC rules and the US’s break of the commitment. This, along with the disappointing release of the Producer Price Index (PPI) and Retail Sales figures from Australia, suggests that the path of least resistance for the AUD/USD pair remains to the downside and supports prospects for a further depreciating move.
Even from a technical perspective, a break below the very important 200-day SMA could be seen as a fresh trigger for bearish traders and validates the negative outlook. Market participants now look forward to the release of the US Core PCE Price Index – the Fed’s preferred inflation gauge – to grab short-term trading opportunities around the AUD/USD pair later during the early North American session. Nevertheless, spot prices seem poised to register losses for the second straight week and remain at the mercy of the USD price dynamics on the last day of the week.
Technical Levels: Supports and Resistances
AUDUSD currently trading at 0.6701 at the time of writing. Pair opened at 0.6709 and is trading with a change of -0.12 % .
| Overview | Overview.1 | |
|---|---|---|
| 0 | Today last price | 0.6701 |
| 1 | Today Daily Change | -0.0008 |
| 2 | Today Daily Change % | -0.1200 |
| 3 | Today daily open | 0.6709 |
The pair is trading below its 20 Daily moving average @ 0.6739, above its 50 Daily moving average @ 0.6698 , above its 100 Daily moving average @ 0.6692 and below its 200 Daily moving average @ 0.6727
| Trends | Trends.1 | |
|---|---|---|
| 0 | Daily SMA20 | 0.6739 |
| 1 | Daily SMA50 | 0.6698 |
| 2 | Daily SMA100 | 0.6692 |
| 3 | Daily SMA200 | 0.6727 |
The previous day high was 0.6821 while the previous day low was 0.6698. The daily 38.2% Fib levels comes at 0.6745, expected to provide resistance. Similarly, the daily 61.8% fib level is at 0.6774, expected to provide resistance.
Note the levels of interest below:
- Pivot support is noted at 0.6665, 0.662, 0.6542
- Pivot resistance is noted at 0.6788, 0.6866, 0.6911
| Levels | Levels.1 |
|---|---|
| Previous Daily High | 0.6821 |
| Previous Daily Low | 0.6698 |
| Previous Weekly High | 0.6854 |
| Previous Weekly Low | 0.6722 |
| Previous Monthly High | 0.6900 |
| Previous Monthly Low | 0.6484 |
| Daily Fibonacci 38.2% | 0.6745 |
| Daily Fibonacci 61.8% | 0.6774 |
| Daily Pivot Point S1 | 0.6665 |
| Daily Pivot Point S2 | 0.6620 |
| Daily Pivot Point S3 | 0.6542 |
| Daily Pivot Point R1 | 0.6788 |
| Daily Pivot Point R2 | 0.6866 |
| Daily Pivot Point R3 | 0.6911 |
[/s2If]
Download Nehcap EAWe have two EAs that are operational on our LIVE accounts.
- EA-FIX: Check out the details here. Download EA-FIX . EA-FIX is a non-grid HFT scalper.
- EA-GROWTH: High quality low dd EA using trend grids. Download EA_GROWTHJoin Our Telegram Group
")


