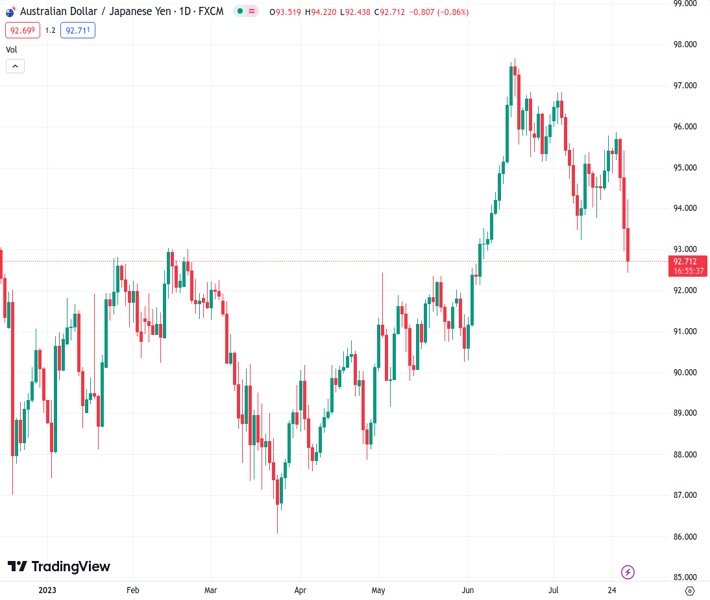
The AUDJPY currency pair, currently trading at 93.0650, has reversed direction from its recent low after the Bank of Japan decided to hold their monetary policy steady. The viewpoint of @nehcap is that there is likely to be more downward movement in the future.
…
This is a premium post.
[s2If !current_user_can(access_s2member_level4)]Please register for FREE REGISTER to read full post below containing analysis. In case of any error or you think you are not able to read the full post below, please email us at support#nehcap.com [lwa][/s2If] [s2If current_user_can(access_s2member_level1)]
- AUD/JPY takes a U-turn from the multi-day low after BoJ keeps monetary policy unchanged.
The pair currently trades last at 93.0650.
The previous day high was 95.42 while the previous day low was 92.96. The daily 38.2% Fib levels comes at 93.9, expected to provide resistance. Similarly, the daily 61.8% fib level is at 94.48, expected to provide resistance.
AUD/JPY offered a stark reaction to the Bank of Japan’s (BoJ) inaction before resuming the original bearish move to around 93.00 amid early Friday. That said, the Bank of Japan (BoJ) left its monetary policy unchanged despite the market’s expectations of witnessing a tweak to the Yield Curve Control (YCC) policy.
Also read:
Technically, the AUD/JPY pair’s sustained trading beneath the previous support line stretched from late March joins bearish MACD signals to keep the sellers hopeful.
However, a horizontal support zone comprising multiple levels marked since early May, around 92.45-40, restricts the immediate downside of the pair.
Even if the quote breaks the 92.40 support area, the 200-day Exponential Moving Average (EMA) will join the 100-EMA and the 50% Fibonacci retracement of its March-June upside to highlight 91.95-90 as the key downside support for the bears to watch.
Alternatively, recovery remains elusive below the support-turned-resistance line, around 93.90 by the press time.
Following that, the 23.6% Fibonacci retracement level surrounding 95.00 and a five-week-old falling resistance line, close to 95.70 at the latest, will test the AUD/JPY bulls before giving them control.
Trend: Further downside expected
Technical Levels: Supports and Resistances
AUDJPY currently trading at 93.25 at the time of writing. Pair opened at 93.56 and is trading with a change of -0.33% % .
| Overview | Overview.1 | |
|---|---|---|
| 0 | Today last price | 93.25 |
| 1 | Today Daily Change | -0.31 |
| 2 | Today Daily Change % | -0.33% |
| 3 | Today daily open | 93.56 |
The pair is trading below its 20 Daily moving average @ 95.1, below its 50 Daily moving average @ 94.38 , above its 100 Daily moving average @ 91.91 and above its 200 Daily moving average @ 91.93
| Trends | Trends.1 | |
|---|---|---|
| 0 | Daily SMA20 | 95.10 |
| 1 | Daily SMA50 | 94.38 |
| 2 | Daily SMA100 | 91.91 |
| 3 | Daily SMA200 | 91.93 |
The previous day high was 95.42 while the previous day low was 92.96. The daily 38.2% Fib levels comes at 93.9, expected to provide resistance. Similarly, the daily 61.8% fib level is at 94.48, expected to provide resistance.
Note the levels of interest below:
- Pivot support is noted at 92.54, 91.53, 90.09
- Pivot resistance is noted at 95.0, 96.44, 97.46
| Levels | Levels.1 |
|---|---|
| Previous Daily High | 95.42 |
| Previous Daily Low | 92.96 |
| Previous Weekly High | 95.79 |
| Previous Weekly Low | 93.78 |
| Previous Monthly High | 97.68 |
| Previous Monthly Low | 90.30 |
| Daily Fibonacci 38.2% | 93.90 |
| Daily Fibonacci 61.8% | 94.48 |
| Daily Pivot Point S1 | 92.54 |
| Daily Pivot Point S2 | 91.53 |
| Daily Pivot Point S3 | 90.09 |
| Daily Pivot Point R1 | 95.00 |
| Daily Pivot Point R2 | 96.44 |
| Daily Pivot Point R3 | 97.46 |
[/s2If]
Download Nehcap EAWe have two EAs that are operational on our LIVE accounts.
- EA-FIX: Check out the details here. Download EA-FIX . EA-FIX is a non-grid HFT scalper.
- EA-GROWTH: High quality low dd EA using trend grids. Download EA_GROWTHJoin Our Telegram Group
")


