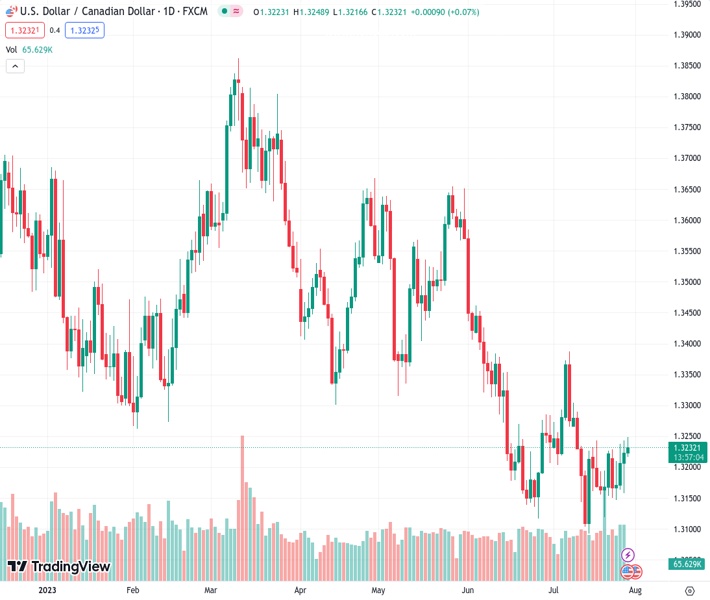
Investors are eagerly anticipating the release of Canadian GDP and US PCE data as the US dollar to Canadian dollar exchange rate, currently at 1.32327, starts to show signs of increasing momentum above the 1.3230 level.
…
This is a premium post.
[s2If !current_user_can(access_s2member_level4)]Please register for FREE REGISTER to read full post below containing analysis. In case of any error or you think you are not able to read the full post below, please email us at support#nehcap.com [lwa][/s2If] [s2If current_user_can(access_s2member_level1)]
- The pair currently trades last at 1.32327.
- Pivot support is noted at 1.3173, 1.3123, 1.3088
- Pivot resistance is noted at 1.3259, 1.3294, 1.3344
- EA-FIX: Check out the details here. Download EA-FIX . EA-FIX is a non-grid HFT scalper.
- EA-GROWTH: High quality low dd EA using trend grids. Download EA_GROWTHJoin Our Telegram Group
The previous day high was 1.3243 while the previous day low was 1.3158. The daily 38.2% Fib levels comes at 1.3211, expected to provide support. Similarly, the daily 61.8% fib level is at 1.3191, expected to provide support.
The USD/CAD pair retreats from 1.3248 and currently trades around 1.3225, up 0.01% for the day. The encouraging GDP figure supports the uptick of the US Dollar. The US Dollar Index (DXY), a measure of the Greenback against a basket of currencies used by US trade partners, holds above 101.70 heading into the early European session. Market participants will keep an eye on the economic data for fresh impetus later in the North American session.
Following the release of upbeat US economic statistics on Thursday, the US dollar has attracted some buyers across the board. The US Bureau of Economic Analysis (BEA) first estimate reported that the US real Gross Domestic Product (GDP) expanded at a 2.4% annualized rate, beating the market expectation of 1.8% and following the 2% growth reported in the first quarter. Meanwhile, Durable Goods Orders rose 4.7% on a monthly basis to $302.5 billion. Initial Jobless Claims declined by 7,000 to 221,000 in the week ending July 22, the lowest reading in five months. The data bolstered optimism that the economy could avoid a recession this year. This, in turn, could support the Greenback and cap the upside in the commodity-linked Loonie.
After the July policy meeting, Fed Chairman Jerome Powell said it’s possible for another 25 basis point (bps) rate rise in September or November if the data warrants it. The more hawkish stance of the Fed than the Bank of Canada (BoC) acts as a tailwind for the USD/CAD pair.
On the Canadian Dollar front, the BoC announced a 25 basis point rate hike to a 22-year high of 5.0% on July 12. BoC Governor Tiff Macklem stated that the central bank would base future policy decisions on the incoming data and the inflation outlook. It’s worth noting that the next policy meeting is scheduled for September 6.
However, market players anticipated that the Bank of Canada (BoC) would likely not see the need to raise rates further this year. According to a survey of market participants released by the central bank on Monday, a median of the participants anticipate the bank to maintain interest rates at a 22-year high of 5.00% until the end of 2023 before cutting the rates in March.
Meanwhile, the uptick in oil prices has supported the Loonie and offset a slowdown in the Canadian manufacturing sector. Higher crude prices strengthen the Canadian Dollar, as the country is the leading oil exporter to the United States.
Later in the day, investors will closely watch the Canadian Gross Domestic Product (GDP) data. The figure is expected to rise by 0.3% from the previous reading of 0%. Also, the Fed’s preferred inflation gauge, US Core Personal Consumption Expenditure (PCE) report, will be released in the North American session. The inflation figure is expected to drop from 4.6% to 4.2% annually. The data will be critical for determining a clear movement for the pair ahead of next week’s employment data.
Technical Levels: Supports and Resistances
USDCAD currently trading at 1.3231 at the time of writing. Pair opened at 1.3224 and is trading with a change of 0.05 % .
| Overview | Overview.1 | |
|---|---|---|
| 0 | Today last price | 1.3231 |
| 1 | Today Daily Change | 0.0007 |
| 2 | Today Daily Change % | 0.0500 |
| 3 | Today daily open | 1.3224 |
The pair is trading above its 20 Daily moving average @ 1.3218, below its 50 Daily moving average @ 1.331 , below its 100 Daily moving average @ 1.3429 and below its 200 Daily moving average @ 1.3465
| Trends | Trends.1 | |
|---|---|---|
| 0 | Daily SMA20 | 1.3218 |
| 1 | Daily SMA50 | 1.3310 |
| 2 | Daily SMA100 | 1.3429 |
| 3 | Daily SMA200 | 1.3465 |
The previous day high was 1.3243 while the previous day low was 1.3158. The daily 38.2% Fib levels comes at 1.3211, expected to provide support. Similarly, the daily 61.8% fib level is at 1.3191, expected to provide support.
Note the levels of interest below:
| Levels | Levels.1 |
|---|---|
| Previous Daily High | 1.3243 |
| Previous Daily Low | 1.3158 |
| Previous Weekly High | 1.3244 |
| Previous Weekly Low | 1.3120 |
| Previous Monthly High | 1.3585 |
| Previous Monthly Low | 1.3117 |
| Daily Fibonacci 38.2% | 1.3211 |
| Daily Fibonacci 61.8% | 1.3191 |
| Daily Pivot Point S1 | 1.3173 |
| Daily Pivot Point S2 | 1.3123 |
| Daily Pivot Point S3 | 1.3088 |
| Daily Pivot Point R1 | 1.3259 |
| Daily Pivot Point R2 | 1.3294 |
| Daily Pivot Point R3 | 1.3344 |
[/s2If]
Download Nehcap EAWe have two EAs that are operational on our LIVE accounts.
")


