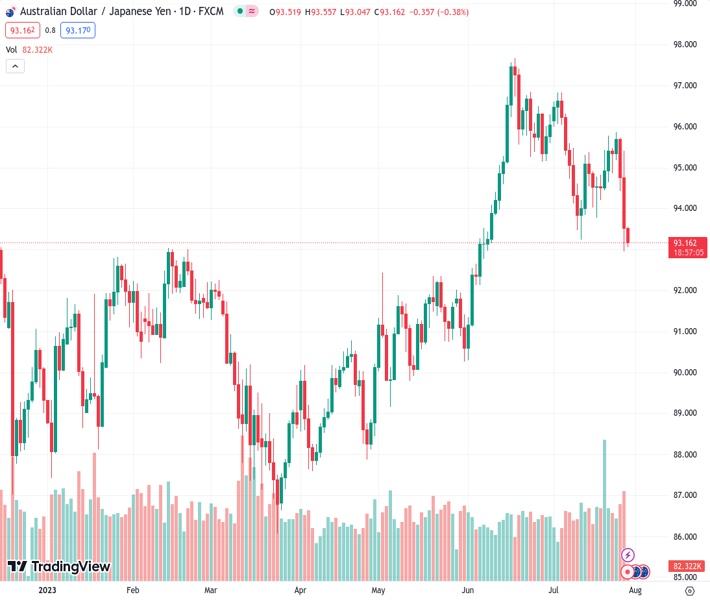
After the release of disappointing economic data regarding Australia’s producer price index and retail sales, the AUDJPY pair at 93.2220 experienced a decline from its previous bounce back up from the intraday low. This outcome has dampened the enthusiasm of Australian currency supporters.
…
This is a premium post.
[s2If !current_user_can(access_s2member_level4)]Please register for FREE REGISTER to read full post below containing analysis. In case of any error or you think you are not able to read the full post below, please email us at support#nehcap.com [lwa][/s2If] [s2If current_user_can(access_s2member_level1)]
- AUD/JPY fades bounce off intraday low after Australia PPI, Retail Sales disappoints Aussie bulls.
The pair currently trades last at 93.2220.
The previous day high was 95.42 while the previous day low was 92.96. The daily 38.2% Fib levels comes at 93.9, expected to provide resistance. Similarly, the daily 61.8% fib level is at 94.48, expected to provide resistance.
AUD/JPY justifies downbeat Australian data, as well as the cautious mood ahead of the Bank of Japan (BoJ) Monetary Policy Meeting, around 93.30 amid early Friday. In doing so, the cross-currency pair prints mild losses at the lowest levels in seven weeks marked the previous day, printing a three-day downtrend by the press time.
Australia Retail Sales slumps 0.8% MoM in June versus 0.0% expected and prior growth of 0.7%. It should be noted that the second-quarter Producer Price Index (PPI) data have been disappointing with 3.9% YoY and 0.5% QoQ figures.
Also read: Australian Retail Sales drop 0.8% MoM in June vs. 0% expected
That said, the quote slumped the most in five weeks the previous day after news from Nikkei signaled that the BoJ may edit its +/- 0.50% limit for the 10-year Japanese Government Bond (JGB) yields in today’s monetary policy announcements. The talks of a likely change in the BoJ’s Yield Curve Control (YCC) policy propelled the JGB to the highest levels in three months after Tokyo inflation.
Earlier in the day, the Statistics Bureau of Japan released monthly prints of the Tokyo Consumer Price Index for July. The details suggest that the headline Tokyo CPI improves to 3.2% YoY from 3.1% prior, versus 2.8% market forecasts, whereas the Tokyo CPI ex Fresh Food, Energy rises to 4.0% from 3.8% previous readings. More importantly, Tokyo CPI ex Fresh Food eases from 3.2% to 3.0% for the said month compared to analysts’ estimations of 2.9%.
Elsewhere, fears of fresh US-China tension due to the White House’s readiness to stop the Hong Kong Leader from attending November’s Asia-Pacific Economic Cooperation (APEC) leaders’ summit in San Francisco seem to also exert downside pressure on the AUD/JPY.
Even so, the S&P500 Futures print mild gains and the US 10-year Treasury bond yields ease from a three-week high after making the biggest daily jump in a month, to 3.99% by the press time.
Looking ahead, AUD/JPY will pay attention to the BoJ moves for clear directions as the YCC tweak could favor the bears.
A daily closing below the four-month-old rising support line, now immediate resistance near 93.85, directs AUD/JPY towards 91.95-90 DMA confluence comprising 100 and 200 moving averages on the daily chart.
Technical Levels: Supports and Resistances
AUDJPY currently trading at 93.4 at the time of writing. Pair opened at 93.56 and is trading with a change of -0.17% % .
| Overview | Overview.1 | |
|---|---|---|
| 0 | Today last price | 93.4 |
| 1 | Today Daily Change | -0.16 |
| 2 | Today Daily Change % | -0.17% |
| 3 | Today daily open | 93.56 |
The pair is trading below its 20 Daily moving average @ 95.1, below its 50 Daily moving average @ 94.38 , above its 100 Daily moving average @ 91.91 and above its 200 Daily moving average @ 91.93
| Trends | Trends.1 | |
|---|---|---|
| 0 | Daily SMA20 | 95.10 |
| 1 | Daily SMA50 | 94.38 |
| 2 | Daily SMA100 | 91.91 |
| 3 | Daily SMA200 | 91.93 |
The previous day high was 95.42 while the previous day low was 92.96. The daily 38.2% Fib levels comes at 93.9, expected to provide resistance. Similarly, the daily 61.8% fib level is at 94.48, expected to provide resistance.
Note the levels of interest below:
- Pivot support is noted at 92.54, 91.53, 90.09
- Pivot resistance is noted at 95.0, 96.44, 97.46
| Levels | Levels.1 |
|---|---|
| Previous Daily High | 95.42 |
| Previous Daily Low | 92.96 |
| Previous Weekly High | 95.79 |
| Previous Weekly Low | 93.78 |
| Previous Monthly High | 97.68 |
| Previous Monthly Low | 90.30 |
| Daily Fibonacci 38.2% | 93.90 |
| Daily Fibonacci 61.8% | 94.48 |
| Daily Pivot Point S1 | 92.54 |
| Daily Pivot Point S2 | 91.53 |
| Daily Pivot Point S3 | 90.09 |
| Daily Pivot Point R1 | 95.00 |
| Daily Pivot Point R2 | 96.44 |
| Daily Pivot Point R3 | 97.46 |
[/s2If]
Download Nehcap EAWe have two EAs that are operational on our LIVE accounts.
- EA-FIX: Check out the details here. Download EA-FIX . EA-FIX is a non-grid HFT scalper.
- EA-GROWTH: High quality low dd EA using trend grids. Download EA_GROWTHJoin Our Telegram Group
")


