The USDJPY is currently experiencing downward pressure and is at its lowest level in a week, showing a trend of decreasing value over the past five days. This is happening before the release of Japan’s inflation data and the Bank of Japan’s announcement. Our view is that the downside potential is limited and there is not much expectation for further decline.
…
This is a premium post.
[s2If !current_user_can(access_s2member_level4)]Please register for FREE REGISTER to read full post below containing analysis. In case of any error or you think you are not able to read the full post below, please email us at support#nehcap.com [lwa][/s2If] [s2If current_user_can(access_s2member_level1)]
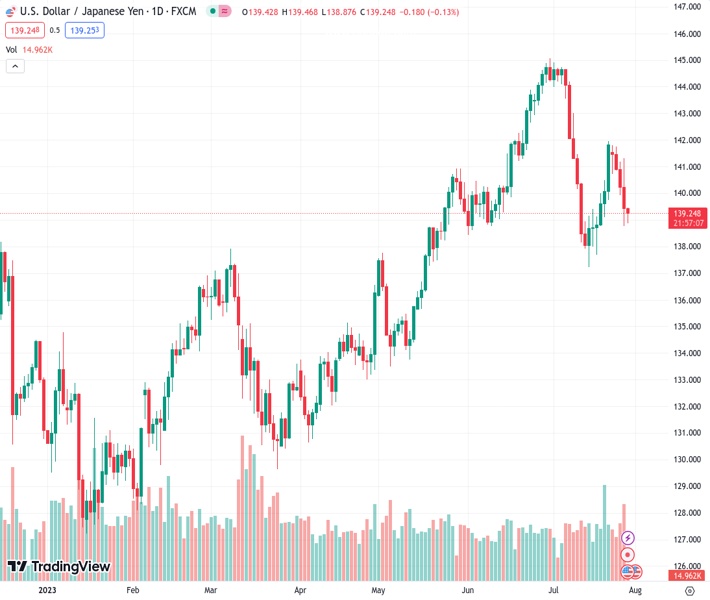
- USD/JPY remains pressured at the lowest level in a week, prints five-day downtrend ahead of Japan inflation, BoJ.
The pair currently trades last at 139.190.
The previous day high was 141.18 while the previous day low was 139.92. The daily 38.2% Fib levels comes at 140.4, expected to provide resistance. Similarly, the daily 61.8% fib level is at 140.7, expected to provide resistance.
USD/JPY bears flirt with the 139.00 round figure during a five-day losing streak ahead of Friday’s Tokyo open. In doing so, the Yen pair justifies the latest chatters surrounding the Bank of Japan’s (BoJ) likely edit to the +/- 0.50% limit of the 10-year Japanese Government Bond (JGB) yields ahead of Japan inflation data and the BoJ monetary policy announcements.
Also read: Breaking: USD/JPY bears firm on a strong hint that BoJ will drop 0.5% cap in 10Y JGB yields
Technically, the bearish MACD signals join the Yen pair’s downside break of the 50% Fibonacci retracement level of October 2022 to January 2023 fall, near 139.60 by the press time, to favor the USD/JPY sellers.
With this, the Yen pair appears well set to prod the horizontal area comprising multiple levels marked since December 2022, close to 138.00-137.80.
Following that, a convergence of the 200-DMA and 38.2% Fibonacci retracement, close to 136.70, will precede the bottom line of a seven-month-old rising channel surrounding 135.60, to limit the USD/JPY downside.
On the contrary, a 50% Fibonacci retracement level of 139.60 and the 140.00 round figure may initially restrict the USD/JPY recovery ahead of directing the bulls to May’s high of near 140.95, quickly followed by the 141.00 round figure.
It’s worth noting, however, that the Yen pair buyers will remain confused unless witnessing a clear upside break of the 61.8% Fibonacci retracement level of 142.52, backed by the dovish BoJ stand.
Trend: Limited downside expected
Technical Levels: Supports and Resistances
USDJPY currently trading at 139.08 at the time of writing. Pair opened at 140.24 and is trading with a change of -0.83% % .
| Overview | Overview.1 | |
|---|---|---|
| 0 | Today last price | 139.08 |
| 1 | Today Daily Change | -1.16 |
| 2 | Today Daily Change % | -0.83% |
| 3 | Today daily open | 140.24 |
The pair is trading below its 20 Daily moving average @ 141.39, below its 50 Daily moving average @ 140.88 , above its 100 Daily moving average @ 137.32 and above its 200 Daily moving average @ 136.79
| Trends | Trends.1 | |
|---|---|---|
| 0 | Daily SMA20 | 141.39 |
| 1 | Daily SMA50 | 140.88 |
| 2 | Daily SMA100 | 137.32 |
| 3 | Daily SMA200 | 136.79 |
The previous day high was 141.18 while the previous day low was 139.92. The daily 38.2% Fib levels comes at 140.4, expected to provide resistance. Similarly, the daily 61.8% fib level is at 140.7, expected to provide resistance.
Note the levels of interest below:
- Pivot support is noted at 139.72, 139.19, 138.45
- Pivot resistance is noted at 140.98, 141.71, 142.24
| Levels | Levels.1 |
|---|---|
| Previous Daily High | 141.18 |
| Previous Daily Low | 139.92 |
| Previous Weekly High | 141.96 |
| Previous Weekly Low | 137.68 |
| Previous Monthly High | 145.07 |
| Previous Monthly Low | 138.43 |
| Daily Fibonacci 38.2% | 140.40 |
| Daily Fibonacci 61.8% | 140.70 |
| Daily Pivot Point S1 | 139.72 |
| Daily Pivot Point S2 | 139.19 |
| Daily Pivot Point S3 | 138.45 |
| Daily Pivot Point R1 | 140.98 |
| Daily Pivot Point R2 | 141.71 |
| Daily Pivot Point R3 | 142.24 |
[/s2If]
Download Nehcap EAWe have two EAs that are operational on our LIVE accounts.
- EA-FIX: Check out the details here. Download EA-FIX . EA-FIX is a non-grid HFT scalper.
- EA-GROWTH: High quality low dd EA using trend grids. Download EA_GROWTHJoin Our Telegram Group
")


