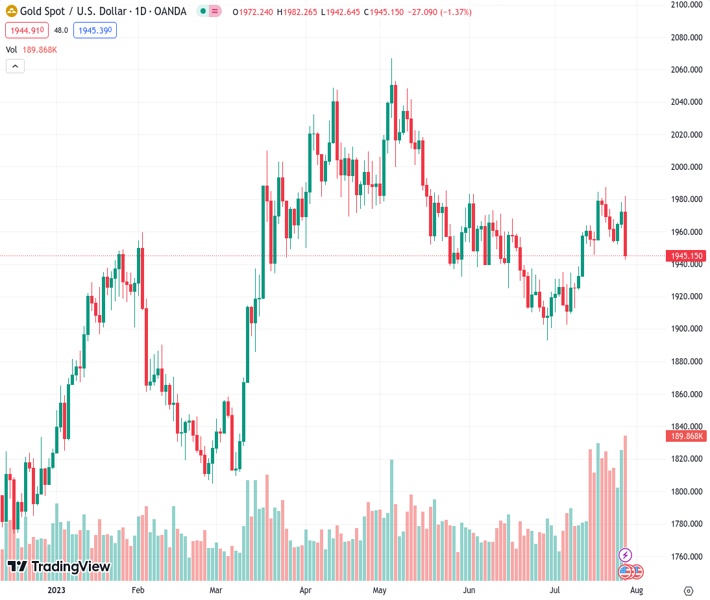
The price of XAUUSD at 1,945.23 experienced a decline of over 1.40% on Thursday, causing it to drop below the 100 and 20-day SMA levels around $1,940.
…
This is a premium post.
[s2If !current_user_can(access_s2member_level4)]Please register for FREE REGISTER to read full post below containing analysis. In case of any error or you think you are not able to read the full post below, please email us at support#nehcap.com [lwa][/s2If] [s2If current_user_can(access_s2member_level1)]
- XAU/USD fell more than 1.40% on Thursday and lost the 100 and 20-day SMA near $1,940.
The pair currently trades last at 1945.23.
The previous day high was 1978.39 while the previous day low was 1962.06. The daily 38.2% Fib levels comes at 1972.15, expected to provide resistance. Similarly, the daily 61.8% fib level is at 1968.3, expected to provide resistance.
On Thursday, non-yielding precious metals faced selling pressure amid strong data from the US, which made markets start to place bets on a possible hike by the Federal Reserve (Fed) in September, which increased US treasury yields.
It’s worth mentioning that Jerome Powell claimed on Wednesday that in September, the Fed may hike or pause, adding that the decision will depend solely on incoming data. In that sense, on Thursday, the US reported that the Q2 Gross Domestic Product (GDP) expanded at a higher annualised pace than expected by increasing monthly Durable Goods Orders in June. In addition, Jobless Claims in the third week of July rose but were lower than anticipated hinting that the US economy is holding firm and may give the Fed room to deliver an additional hike.
As a reaction, US Treasury yields, which could be seen as the opportunity cost of holding Gold, increased across the board, applying pressure on the XAU/USD. The 2-year rate rose to 4.92%, the 5-year yield to 4.23%, and the 10-year to 4.00%, with all three seeing more than 1% increases.
The daily chart suggests that the technical outlook for the XAU/USD has turned bearish for the short term. The Relative Strength Index (RSI) collapsed into negative territory, while the Moving Average Convergence Divergence (MACD) prints fading green bars, suggesting that the bears are in command. In addition, the price has fallen below the 20 and 100-day Simple Moving Averages (SMAs).
Support levels: $1,930, $1,915, $1,900.
Resistance levels: $1,945 (20-day SMA), $1,965 (100-day SMA), $1,980.
Technical Levels: Supports and Resistances
XAUUSD currently trading at 1944.63 at the time of writing. Pair opened at 1972.17 and is trading with a change of -1.4 % .
| Overview | Overview.1 | |
|---|---|---|
| 0 | Today last price | 1944.63 |
| 1 | Today Daily Change | -27.54 |
| 2 | Today Daily Change % | -1.40 |
| 3 | Today daily open | 1972.17 |
The pair is trading above its 20 Daily moving average @ 1944.52, below its 50 Daily moving average @ 1947.2 , below its 100 Daily moving average @ 1964.53 and above its 200 Daily moving average @ 1884.5
| Trends | Trends.1 | |
|---|---|---|
| 0 | Daily SMA20 | 1944.52 |
| 1 | Daily SMA50 | 1947.20 |
| 2 | Daily SMA100 | 1964.53 |
| 3 | Daily SMA200 | 1884.50 |
The previous day high was 1978.39 while the previous day low was 1962.06. The daily 38.2% Fib levels comes at 1972.15, expected to provide resistance. Similarly, the daily 61.8% fib level is at 1968.3, expected to provide resistance.
Note the levels of interest below:
- Pivot support is noted at 1963.36, 1954.54, 1947.03
- Pivot resistance is noted at 1979.69, 1987.2, 1996.02
| Levels | Levels.1 |
|---|---|
| Previous Daily High | 1978.39 |
| Previous Daily Low | 1962.06 |
| Previous Weekly High | 1987.54 |
| Previous Weekly Low | 1945.85 |
| Previous Monthly High | 1983.50 |
| Previous Monthly Low | 1893.01 |
| Daily Fibonacci 38.2% | 1972.15 |
| Daily Fibonacci 61.8% | 1968.30 |
| Daily Pivot Point S1 | 1963.36 |
| Daily Pivot Point S2 | 1954.54 |
| Daily Pivot Point S3 | 1947.03 |
| Daily Pivot Point R1 | 1979.69 |
| Daily Pivot Point R2 | 1987.20 |
| Daily Pivot Point R3 | 1996.02 |
[/s2If]
Download Nehcap EAWe have two EAs that are operational on our LIVE accounts.
- EA-FIX: Check out the details here. Download EA-FIX . EA-FIX is a non-grid HFT scalper.
- EA-GROWTH: High quality low dd EA using trend grids. Download EA_GROWTHJoin Our Telegram Group
")


