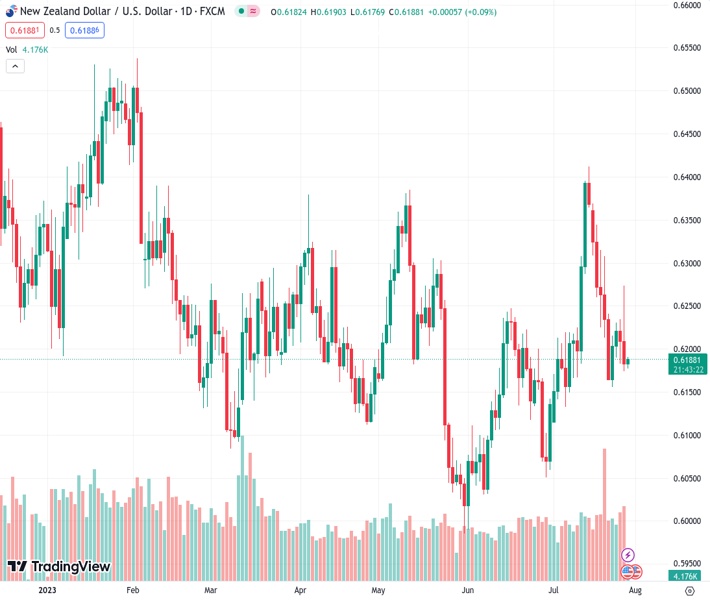
The currency pair NZDUSD, which was previously at a rate of 0.61830, has experienced a decrease in momentum and is currently being traded at approximately 0.6188. Its value has increased by 0.1% throughout the day.
…
This is a premium post.
[s2If !current_user_can(access_s2member_level4)]Please register for FREE REGISTER to read full post below containing analysis. In case of any error or you think you are not able to read the full post below, please email us at support#nehcap.com [lwa][/s2If] [s2If current_user_can(access_s2member_level1)]
- NZD/USD loses momentum and currently trades around 0.6188, gaining 0.1% for the day.
The pair currently trades last at 0.61830.
The previous day high was 0.6236 while the previous day low was 0.6183. The daily 38.2% Fib levels comes at 0.6203, expected to provide resistance. Similarly, the daily 61.8% fib level is at 0.6216, expected to provide resistance.
The NZD/USD pair loses its traction and holds below the 0.6200 area in the early Asian session after retreating from a weekly high of 0.6275. The US dollar Index (DXY), a measure of the value of the Greenback against six other major currencies, jumps to its highest level since July 11, near 101.70, as upbeat US economic figures boosts the Greenback on Friday.
As widely expected, the Federal Reserve (Fed) raised interest rates by 25 basis points (bps) to 5.25%–5.5% on Wednesday. The rate was last seen just before the housing market collapse in 2007 and marked the highest level in more than 22 years.
On Thursday, the US Bureau of Economic Analysis (BEA) first estimate reported that the US real Gross Domestic Product(GDP) expanded at a 2.4% annualized rate, beating the market expectation of 1.8% and following the 2% growth reported in the first quarter. Meanwhile, Durable Goods Orders rose 4.7% on a monthly basis to $302.5 billion. Initial Jobless Claims declined by 7,000 to 221,000 in the week ending July 22. It is the lowest reading in five months.
Due to the lack of significant data released from the New Zealand docket this week, it is difficult for the Kiwi to construct a bullish narrative, and the offshore events will be in the spotlight. However, the market expects a more hawkish stance from the Reserve Bank of New Zealand (RBNZ), which might raise the risk of a hard landing. This, in turn, could weigh on the Kiwi and act as a headwind for NZD/USD.
Looking ahead, the USD’s valuation will likely continue to influence the pair’s movement later in the day. Market participants will keep an eye on the US Core Personal Consumption Expenditure (PCE) index, the Fed’s preferred inflation gauge. The figure is expected to drop from 4.6% to 4.2% annually.
Technical Levels: Supports and Resistances
NZDUSD currently trading at 0.619 at the time of writing. Pair opened at 0.621 and is trading with a change of -0.32 % .
| Overview | Overview.1 | |
|---|---|---|
| 0 | Today last price | 0.619 |
| 1 | Today Daily Change | -0.002 |
| 2 | Today Daily Change % | -0.320 |
| 3 | Today daily open | 0.621 |
The pair is trading below its 20 Daily moving average @ 0.6221, above its 50 Daily moving average @ 0.6168 , below its 100 Daily moving average @ 0.6197 and below its 200 Daily moving average @ 0.6214
| Trends | Trends.1 | |
|---|---|---|
| 0 | Daily SMA20 | 0.6221 |
| 1 | Daily SMA50 | 0.6168 |
| 2 | Daily SMA100 | 0.6197 |
| 3 | Daily SMA200 | 0.6214 |
The previous day high was 0.6236 while the previous day low was 0.6183. The daily 38.2% Fib levels comes at 0.6203, expected to provide resistance. Similarly, the daily 61.8% fib level is at 0.6216, expected to provide resistance.
Note the levels of interest below:
- Pivot support is noted at 0.6183, 0.6156, 0.6129
- Pivot resistance is noted at 0.6237, 0.6263, 0.629
| Levels | Levels.1 |
|---|---|
| Previous Daily High | 0.6236 |
| Previous Daily Low | 0.6183 |
| Previous Weekly High | 0.6370 |
| Previous Weekly Low | 0.6163 |
| Previous Monthly High | 0.6250 |
| Previous Monthly Low | 0.5990 |
| Daily Fibonacci 38.2% | 0.6203 |
| Daily Fibonacci 61.8% | 0.6216 |
| Daily Pivot Point S1 | 0.6183 |
| Daily Pivot Point S2 | 0.6156 |
| Daily Pivot Point S3 | 0.6129 |
| Daily Pivot Point R1 | 0.6237 |
| Daily Pivot Point R2 | 0.6263 |
| Daily Pivot Point R3 | 0.6290 |
[/s2If]
Download Nehcap EAWe have two EAs that are operational on our LIVE accounts.
- EA-FIX: Check out the details here. Download EA-FIX . EA-FIX is a non-grid HFT scalper.
- EA-GROWTH: High quality low dd EA using trend grids. Download EA_GROWTHJoin Our Telegram Group
")


