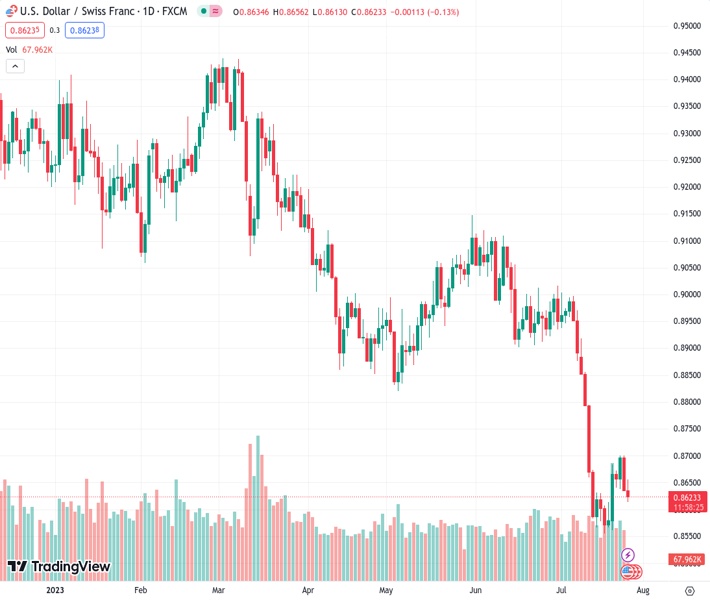
The USDCHF currency pair is experiencing a downward movement for the second consecutive day, influenced by slight weakness in the USD.
…
This is a premium post.
[s2If !current_user_can(access_s2member_level4)]Please register for FREE REGISTER to read full post below containing analysis. In case of any error or you think you are not able to read the full post below, please email us at support#nehcap.com [lwa][/s2If] [s2If current_user_can(access_s2member_level1)]
- USD/CHF drifts lower for the second straight day and is pressured by modest USD weakness.
The pair currently trades last at 0.86254.
The previous day high was 0.8701 while the previous day low was 0.8636. The daily 38.2% Fib levels comes at 0.8661, expected to provide resistance. Similarly, the daily 61.8% fib level is at 0.8676, expected to provide resistance.
The USD/CHF pair attracts fresh selling following an intraday uptick to the 0.8655 region and drifts into negative territory for the second successive day on Wednesday. Spot prices drop to a fresh weekly low during the early European session and currently trade around the 0.8620 area, down nearly 0.20% for the day.
The US Dollar (USD) extends the overnight modest pullback from a two-week high and continues losing ground for the second straight day, which turns out to be a key factor exerting some downward pressure on the USD/CHF pair. The USD downtick could be attributed to some repositioning trade ahead of the crucial FOMC decision, though is likely to remain limited as traders await fresh cues about the near-term policy outlook.
It is worth mentioning that the markets have been pricing out the possibility of any further rate hikes this year after the widely expected 25 bps later this Wednesday. Investors, however, remain sceptic if the Federal Reserve (Fed) will commit to a more dovish stance on the back of an extremely resilient US economy. In fact, Tuesday’s upbeat US Consumer Confidence Index raised optimism that the economy could skip a recession this year.
Hence, the accompanying monetary policy statement and Fed Chair Jerome Powell’s comments during the post-meeting press conference will be scrutinized closely for hints about the future rate-hike path. This, in turn, will influence the USD dynamics and provide a fresh directional impetus to the USD/CHF pair. In the meantime, a positive risk tone might undermine the safe-haven Swiss Franc (CHF) and lend support to spot prices.
Investors continue to cheer China’s pledge to step up support for its fragile economy, which remains supportive of the bullish sentiment across the global equity markets. It is worth recalling that state news agency Xinhua cited the Politburo – the top decision-making body of the ruling Communist Party – saying that China will step up economic policy adjustments, focusing on expanding domestic demand, boosting confidence and preventing risks.
The aforementioned fundamental backdrop supports prospects for the emergence of some dip-buying at lower levels and warrants some caution for aggressive bearish traders. That said, it will be prudent to wait for a sustained move beyond the overnight swing low, around the 0.8700 mark, before confirming that the USD/CHF pair has bottomed out near the 0.8560 region, or the lowest level since January 2015 touched earlier this month.
Technical Levels: Supports and Resistances
USDCHF currently trading at 0.8622 at the time of writing. Pair opened at 0.8638 and is trading with a change of -0.19 % .
| Overview | Overview.1 | |
|---|---|---|
| 0 | Today last price | 0.8622 |
| 1 | Today Daily Change | -0.0016 |
| 2 | Today Daily Change % | -0.1900 |
| 3 | Today daily open | 0.8638 |
The pair remains strongly bearish on the daily time frame. It trades below the 20 SMA @ 0.8782, 50 SMA 0.8923, 100 SMA @ 0.8988 and 200 SMA @ 0.9205.
| Trends | Trends.1 | |
|---|---|---|
| 0 | Daily SMA20 | 0.8782 |
| 1 | Daily SMA50 | 0.8923 |
| 2 | Daily SMA100 | 0.8988 |
| 3 | Daily SMA200 | 0.9205 |
The previous day high was 0.8701 while the previous day low was 0.8636. The daily 38.2% Fib levels comes at 0.8661, expected to provide resistance. Similarly, the daily 61.8% fib level is at 0.8676, expected to provide resistance.
Note the levels of interest below:
- Pivot support is noted at 0.8616, 0.8594, 0.8552
- Pivot resistance is noted at 0.868, 0.8723, 0.8745
| Levels | Levels.1 |
|---|---|
| Previous Daily High | 0.8701 |
| Previous Daily Low | 0.8636 |
| Previous Weekly High | 0.8684 |
| Previous Weekly Low | 0.8555 |
| Previous Monthly High | 0.9120 |
| Previous Monthly Low | 0.8902 |
| Daily Fibonacci 38.2% | 0.8661 |
| Daily Fibonacci 61.8% | 0.8676 |
| Daily Pivot Point S1 | 0.8616 |
| Daily Pivot Point S2 | 0.8594 |
| Daily Pivot Point S3 | 0.8552 |
| Daily Pivot Point R1 | 0.8680 |
| Daily Pivot Point R2 | 0.8723 |
| Daily Pivot Point R3 | 0.8745 |
[/s2If]
Download Nehcap EAWe have two EAs that are operational on our LIVE accounts.
- EA-FIX: Check out the details here. Download EA-FIX . EA-FIX is a non-grid HFT scalper.
- EA-GROWTH: High quality low dd EA using trend grids. Download EA_GROWTHJoin Our Telegram Group
")


