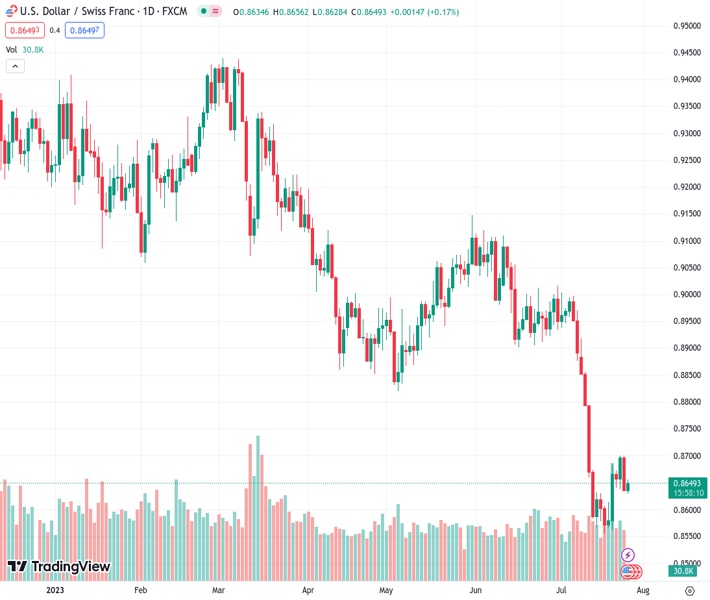
The USDCHF currency pair experiences a slight increase in momentum on Wednesday at a rate of 0.86499, although it does not sustain this growth.
…
This is a premium post.
[s2If !current_user_can(access_s2member_level4)]Please register for FREE REGISTER to read full post below containing analysis. In case of any error or you think you are not able to read the full post below, please email us at support#nehcap.com [lwa][/s2If] [s2If current_user_can(access_s2member_level1)]
- USD/CHF gains some positive traction on Wednesday, albeit lacks follow-through.
The pair currently trades last at 0.86499.
The previous day high was 0.8701 while the previous day low was 0.8636. The daily 38.2% Fib levels comes at 0.8661, expected to provide resistance. Similarly, the daily 61.8% fib level is at 0.8676, expected to provide resistance.
The USD/CHF pair attracts some buying near the 0.8630 area, or a multi-day low touched during the Asian session on Wednesday and for now, seems to have stalled the previous day’s rejection slide from the 0.8700 mark, or a nearly two-week high. Spot prices, however, struggle to capitalize on the modest intraday uptick and currently trade just below mid-0.8600s, up less than 0.10% for the day.
From a technical perspective, last week’s sustained break and acceptance above the 200-hour Simple Moving Average (SMA) was seen as a fresh trigger for bullish traders. That said, oscillators on the hourly chart are yet to confirm a positive bias and are holding deep in the bearish territory on the daily chart. The mixed setup makes it prudent to wait for strong follow-through buying before confirming that the USD/CHF pair has formed a bottom near the 0.8555 region, or a multi-year low touched earlier this month, and positioning for any further appreciating move.
Traders might also refrain from placing aggressive bets and prefer to wait on the sidelines ahead of the key central bank event risk – the outcome of the highly-anticipated two-day FOMC monetary policy meeting. The Federal Reserve (Fed) is due to announce its decision later this Wednesday and is expected to hike interest rates by 25 bps. The focus, meanwhile, remains on the accompanying policy statement and Fed Chair Jerome Powell’s remarks at the post-meeting presser, which will be scrutinized for cues about the future rate-hike path and drive the US Dollar (USD).
In the meantime, any subsequent positive move is more likely to confront stiff resistance and remain capped near the 0.8700 mark. The said handle should act as a pivotal point, which if cleared decisively might trigger a short-covering rally and lift the USD/CHF pair towards the 0.8800 round figure. This is followed by resistance near the 0.8830-0.8835 region. A sustained strength beyond the latter might shift the bias in favour of bullish traders and pave the way for additional near-term gains towards the 0.8900 strong horizontal support breakpoint, now turned resistance.
On the flip side, the 0.8635-0.8630 region now seems to have emerged as an immediate support. This is followed by the 0.8600 round figure, below which the USD/CHF pair is likely to challenge the multi-year low, around the 0.8555 zone. Some follow-through selling will be seen as a fresh trigger for bearish traders, making spot prices vulnerable to accelerate the downtrend witnessed since the beginning of this month and dropping to the 0.8500 psychological mark.
Technical Levels: Supports and Resistances
USDCHF currently trading at 0.8648 at the time of writing. Pair opened at 0.8638 and is trading with a change of 0.12 % .
| Overview | Overview.1 | |
|---|---|---|
| 0 | Today last price | 0.8648 |
| 1 | Today Daily Change | 0.0010 |
| 2 | Today Daily Change % | 0.1200 |
| 3 | Today daily open | 0.8638 |
The pair remains strongly bearish on the daily time frame. It trades below the 20 SMA @ 0.8782, 50 SMA 0.8923, 100 SMA @ 0.8988 and 200 SMA @ 0.9205.
| Trends | Trends.1 | |
|---|---|---|
| 0 | Daily SMA20 | 0.8782 |
| 1 | Daily SMA50 | 0.8923 |
| 2 | Daily SMA100 | 0.8988 |
| 3 | Daily SMA200 | 0.9205 |
The previous day high was 0.8701 while the previous day low was 0.8636. The daily 38.2% Fib levels comes at 0.8661, expected to provide resistance. Similarly, the daily 61.8% fib level is at 0.8676, expected to provide resistance.
Note the levels of interest below:
- Pivot support is noted at 0.8616, 0.8594, 0.8552
- Pivot resistance is noted at 0.868, 0.8723, 0.8745
| Levels | Levels.1 |
|---|---|
| Previous Daily High | 0.8701 |
| Previous Daily Low | 0.8636 |
| Previous Weekly High | 0.8684 |
| Previous Weekly Low | 0.8555 |
| Previous Monthly High | 0.9120 |
| Previous Monthly Low | 0.8902 |
| Daily Fibonacci 38.2% | 0.8661 |
| Daily Fibonacci 61.8% | 0.8676 |
| Daily Pivot Point S1 | 0.8616 |
| Daily Pivot Point S2 | 0.8594 |
| Daily Pivot Point S3 | 0.8552 |
| Daily Pivot Point R1 | 0.8680 |
| Daily Pivot Point R2 | 0.8723 |
| Daily Pivot Point R3 | 0.8745 |
[/s2If]
Download Nehcap EAWe have two EAs that are operational on our LIVE accounts.
- EA-FIX: Check out the details here. Download EA-FIX . EA-FIX is a non-grid HFT scalper.
- EA-GROWTH: High quality low dd EA using trend grids. Download EA_GROWTHJoin Our Telegram Group
")


