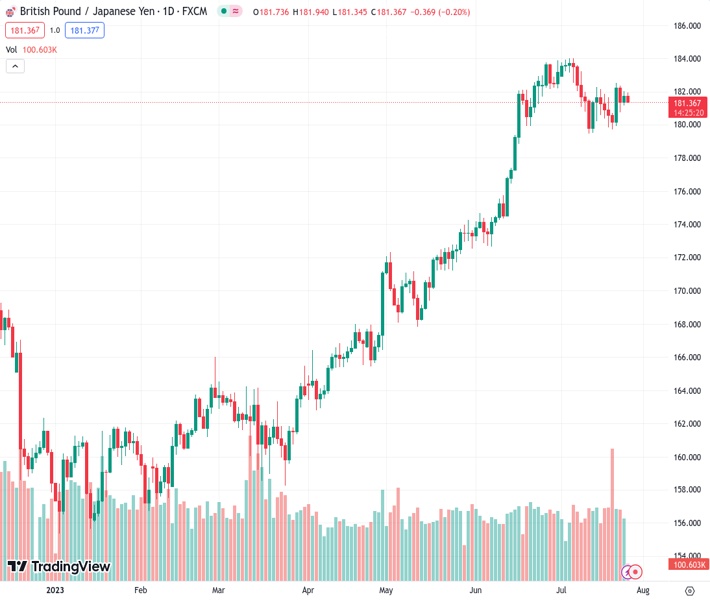
The GBPJPY pair at 181.418 is finding it difficult to hold on to the gains achieved in the previous day due to a slow trading session.
…
This is a premium post.
[s2If !current_user_can(access_s2member_level4)]Please register for FREE REGISTER to read full post below containing analysis. In case of any error or you think you are not able to read the full post below, please email us at support#nehcap.com [lwa][/s2If] [s2If current_user_can(access_s2member_level1)]
- GBP/JPY struggles to defend the previous day’s gains amid sluggish session.
The pair currently trades last at 181.418.
The previous day high was 182.02 while the previous day low was 181.16. The daily 38.2% Fib levels comes at 181.69, expected to provide resistance. Similarly, the daily 61.8% fib level is at 181.48, expected to provide resistance.
GBP/JPY treads water around 181.90-80 heading into Wednesday’s London open, struggling to extend the previous day’s recovery by the press time. In doing so, the cross-currency pair fails to cheer headlines from Japan, as well as comparatively better UK fundamentals, amid the sluggish markets ahead of this week’s top-tier events, namely monetary policy meetings of the Federal Reserve (Fed), European Central Bank (ECB) and the Bank of Japan (BoJ).
Recently, Japanese Cabinet Office published its monthly economic assessment portraying an upbeat picture of the business sentiment. On Tuesday, the Japanese government released its inflation outlook while stating that the inflation is seen staying around 0.7% in the longer term. The government also added, “Wages are projected to increase by 2.5% in FY24, following a 2.6% jump in FY23.” (FY=Fiscal Year)
However, the International Monetary Fund (IMF) warned of higher inflation from Japan and urged the Bank of Japan (BoJ) to exit its easy-money policy, which in turn prods the GBP/JPY bulls. Further, mixed prints of Japan’s Coincident Index and Leading Economic Index for May, to 114.3 and 109.2 versus 113.8 and 109.5, also challenge the pair’s latest moves.
On the contrary, the IMF sticks to 0.4% forecasts of the 2023 UK Gross Domestic Product (GDP) and relied on heaper energy, better relations with the European Union and calmer financial markets, per Reuters, as the key catalysts to propel the British Pound (GBP). Furthermore, the Reuters poll about the Bank of England’s (BoE) suggests that the Old Lady, as the BoE is informally known, is likely to announce two more rate hikes in 2023, which in turn favor GBP/JPY bulls.
Though, the market’s preparations for the BoJ’s status quo appear to restrict the pair’s immediate upside.
Against this backdrop, S&P500 Futures grinds near the one-week high marked the previous day whereas the US 10-year and two-year Treasury bond yield print mild gains around a two-week high registered Tuesday, close to 3.89% and 4.88% in that order by the press time.
Moving on, a light calendar may restrict GBP/JPY moves but performance of the bond markets and the reaction to the Fed meeting, as well as the risk catalysts surrounding China, may entertain the pair traders.
Repeated failures to cross a three-week-old descending resistance line, around 182.15, lures GBP/JPY bears amid a sluggish start to the key day comprising Federal Reserve (Fed) monetary policy meeting announcements.
Technical Levels: Supports and Resistances
GBPJPY currently trading at 181.76 at the time of writing. Pair opened at 181.81 and is trading with a change of -0.03% % .
| Overview | Overview.1 | |
|---|---|---|
| 0 | Today last price | 181.76 |
| 1 | Today Daily Change | -0.05 |
| 2 | Today Daily Change % | -0.03% |
| 3 | Today daily open | 181.81 |
The pair is trading below its 20 Daily moving average @ 182.03, above its 50 Daily moving average @ 178.47 , above its 100 Daily moving average @ 172.03 and above its 200 Daily moving average @ 167.74
| Trends | Trends.1 | |
|---|---|---|
| 0 | Daily SMA20 | 182.03 |
| 1 | Daily SMA50 | 178.47 |
| 2 | Daily SMA100 | 172.03 |
| 3 | Daily SMA200 | 167.74 |
The previous day high was 182.02 while the previous day low was 181.16. The daily 38.2% Fib levels comes at 181.69, expected to provide resistance. Similarly, the daily 61.8% fib level is at 181.48, expected to provide resistance.
Note the levels of interest below:
- Pivot support is noted at 181.3, 180.8, 180.44
- Pivot resistance is noted at 182.17, 182.52, 183.03
| Levels | Levels.1 |
|---|---|
| Previous Daily High | 182.02 |
| Previous Daily Low | 181.16 |
| Previous Weekly High | 182.53 |
| Previous Weekly Low | 179.74 |
| Previous Monthly High | 183.88 |
| Previous Monthly Low | 172.67 |
| Daily Fibonacci 38.2% | 181.69 |
| Daily Fibonacci 61.8% | 181.48 |
| Daily Pivot Point S1 | 181.30 |
| Daily Pivot Point S2 | 180.80 |
| Daily Pivot Point S3 | 180.44 |
| Daily Pivot Point R1 | 182.17 |
| Daily Pivot Point R2 | 182.52 |
| Daily Pivot Point R3 | 183.03 |
[/s2If]
Download Nehcap EAWe have two EAs that are operational on our LIVE accounts.
- EA-FIX: Check out the details here. Download EA-FIX . EA-FIX is a non-grid HFT scalper.
- EA-GROWTH: High quality low dd EA using trend grids. Download EA_GROWTHJoin Our Telegram Group
")


