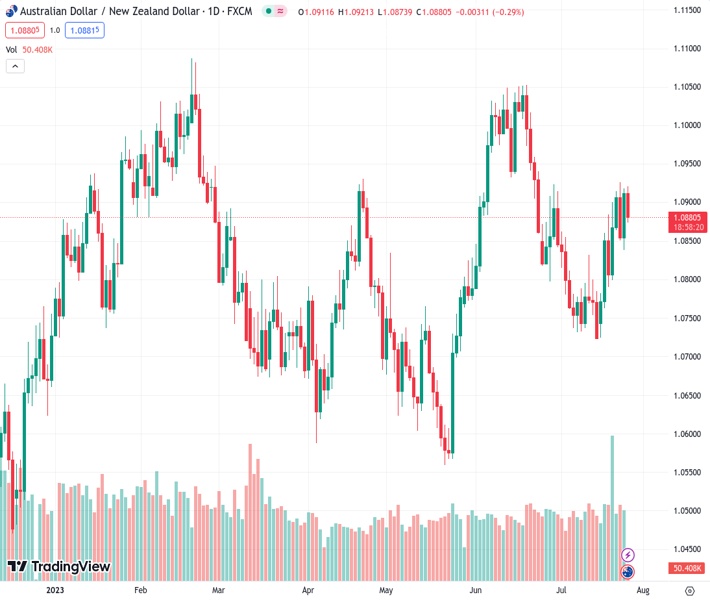
#AUDNZD at 1.08846 is seeing selling pressure, reaching a new intraday low due to disappointing Australian inflation data. Analysts predict that there will be more downward movement in the near future.
…
This is a premium post.
[s2If !current_user_can(access_s2member_level4)]Please register for FREE REGISTER to read full post below containing analysis. In case of any error or you think you are not able to read the full post below, please email us at support#nehcap.com [lwa][/s2If] [s2If current_user_can(access_s2member_level1)]
- AUD/NZD takes offers to refresh intraday low after downbeat Australia inflation.
The pair currently trades last at 1.08846.
The previous day high was 1.0918 while the previous day low was 1.0847. The daily 38.2% Fib levels comes at 1.0891, expected to provide resistance. Similarly, the daily 61.8% fib level is at 1.0874, expected to provide support.
AUD/NZD portrays the market’s disappointment with Australian inflation data while declining to 1.0880 early Wednesday. In doing so, the exotic pair extends reversal from a one-month-old horizontal resistance while poking the 200-SMA of late.
That said, Australia’s Consumer Price Index (CPI) for the second quarter (Q2) of 2023 drops to 0.8% QoQ versus 1.0% expected and 1.4% prior while the Reserve Bank of Australia (RBA) Trimmed Mean CPI came in as 1.0% compared to 1.1% market forecasts and 1.2% prior for the said period. Further, the Monthly CPI matches 5.4% analysts’ expectations for June versus 5.6% prior.
Also read: AUD/USD slumps 40 pips towards 0.6700 on downbeat Australia inflation, Fed Chair Powell’s speech eyed
With this, the RBA’s latest pause in the rate hike trajectory gets validation and suggests further hardships for the Australian Dollar (AUD) bulls, especially amid the shift in the sentiment ahead of the Federal Open Market Committee (FOMC) monetary policy meeting announcements.
Technically, the AUD/NZD pair’s inability to cross the multiple hurdles marked since late June around 1.0925 joins the bearish MACD signals to keep the sellers hopeful.
However, the 200-SMA and a one-week-old rising support line, respectively near 1.0875 and 1.0870, prod the AUD/NZD bears. Following that, a quick fall towards the 1.0800 round figure can’t be ruled out.
Meanwhile, an upside break of the aforementioned horizontal resistance line, near 1.0930, isn’t an open ticket for the AUD/NZD buyers as the 61.8% Fibonacci retracement of June-July fall and June 22 swing high, close to 1.0935 and 1.0945 in that order, could challenge the bulls afterward.
Trend: Further downside expected
Technical Levels: Supports and Resistances
AUDNZD currently trading at 1.0915 at the time of writing. Pair opened at 1.0917 and is trading with a change of -0.02% % .
| Overview | Overview.1 | |
|---|---|---|
| 0 | Today last price | 1.0915 |
| 1 | Today Daily Change | -0.0002 |
| 2 | Today Daily Change % | -0.02% |
| 3 | Today daily open | 1.0917 |
The pair remains strongly bullish on the daily timeframe. It trades above its 20 SMA @ 1.0821, 50 SMA 1.0845, 100 SMA @ 1.0792 and 200 SMA @ 1.0822.
| Trends | Trends.1 | |
|---|---|---|
| 0 | Daily SMA20 | 1.0821 |
| 1 | Daily SMA50 | 1.0845 |
| 2 | Daily SMA100 | 1.0792 |
| 3 | Daily SMA200 | 1.0822 |
The previous day high was 1.0918 while the previous day low was 1.0847. The daily 38.2% Fib levels comes at 1.0891, expected to provide resistance. Similarly, the daily 61.8% fib level is at 1.0874, expected to provide support.
Note the levels of interest below:
- Pivot support is noted at 1.087, 1.0823, 1.0799
- Pivot resistance is noted at 1.0941, 1.0965, 1.1012
| Levels | Levels.1 |
|---|---|
| Previous Daily High | 1.0918 |
| Previous Daily Low | 1.0847 |
| Previous Weekly High | 1.0917 |
| Previous Weekly Low | 1.0725 |
| Previous Monthly High | 1.1062 |
| Previous Monthly Low | 1.0796 |
| Daily Fibonacci 38.2% | 1.0891 |
| Daily Fibonacci 61.8% | 1.0874 |
| Daily Pivot Point S1 | 1.0870 |
| Daily Pivot Point S2 | 1.0823 |
| Daily Pivot Point S3 | 1.0799 |
| Daily Pivot Point R1 | 1.0941 |
| Daily Pivot Point R2 | 1.0965 |
| Daily Pivot Point R3 | 1.1012 |
[/s2If]
Download Nehcap EAWe have two EAs that are operational on our LIVE accounts.
- EA-FIX: Check out the details here. Download EA-FIX . EA-FIX is a non-grid HFT scalper.
- EA-GROWTH: High quality low dd EA using trend grids. Download EA_GROWTHJoin Our Telegram Group
")


