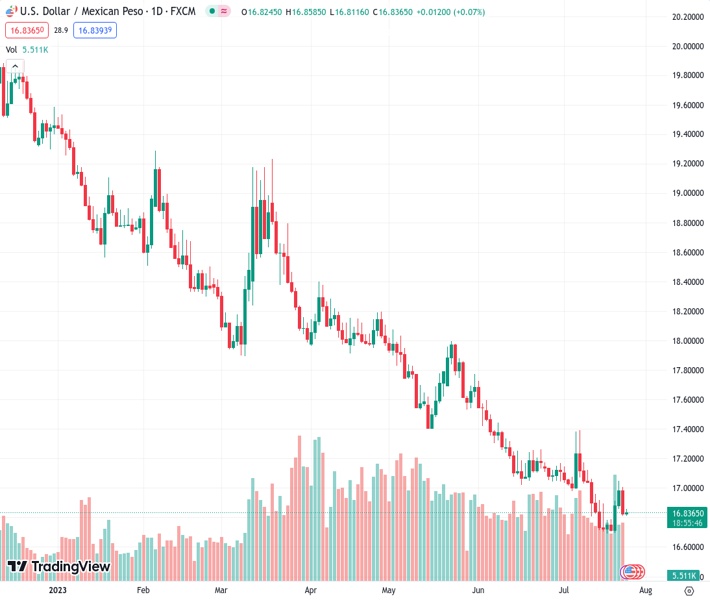
The USDMXN currency pair, trading at a rate of 16.8372, has recovered some of its previous losses and is currently showing slight upward momentum, supported by the important moving average level. The overall expectation is that any further decline in value will be limited.
…
This is a premium post.
[s2If !current_user_can(access_s2member_level4)]Please register for FREE REGISTER to read full post below containing analysis. In case of any error or you think you are not able to read the full post below, please email us at support#nehcap.com [lwa][/s2If] [s2If current_user_can(access_s2member_level1)]
- USD/MXN pares heavy losses above the key moving average support, mildly bid of late.
The pair currently trades last at 16.8372.
The previous day high was 17.0097 while the previous day low was 16.8129. The daily 38.2% Fib levels comes at 16.888, expected to provide resistance. Similarly, the daily 61.8% fib level is at 16.9345, expected to provide resistance.
USD/MXN struggles to defend the previous corrective bounce off the 200-Hour Simple Moving Average (SMA) during early Tuesday morning in Asia, edges higher around 16.85 by the press time.
Although the 200-HMA restricts the immediate downside of the USD/MXN pair near 16.82, a clear downside break of the rising support line from July 20, now immediate resistance around 16.88, can prod the Mexican Peso (MXN) pair buyers.
It’s worth noting that the looming bull cross on the MACD defends the USD/MXN bulls amid a nearly oversold RSI (14) line.
That said, a successful break of the support-turned-resistance line, close to16.88 isn’t enough to convince the USD/MXN bulls as a downward-sloping resistance line from July 21, close to 16.98, quickly followed by the 17.00 round figure, can test the pair buyers.
Following that, a run-up toward the monthly high of around 17.40 can’t be ruled out.
On the flip side, a clear break of the 200-SMA support of near 16.82 becomes necessary to convince the USD/MXN sellers.
Even so, multiple levels marked since July 18 prod the pair bears around 16.78 before directing them to the late 2015 region tested the last week around 16.69.
Trend: Limited downside expected
Technical Levels: Supports and Resistances
USDMXN currently trading at 16.8428 at the time of writing. Pair opened at 16.8303 and is trading with a change of 0.07% % .
| Overview | Overview.1 | |
|---|---|---|
| 0 | Today last price | 16.8428 |
| 1 | Today Daily Change | 0.0125 |
| 2 | Today Daily Change % | 0.07% |
| 3 | Today daily open | 16.8303 |
The pair remains strongly bearish on the daily time frame. It trades below the 20 SMA @ 16.9708, 50 SMA 17.2566, 100 SMA @ 17.7063 and 200 SMA @ 18.4506.
| Trends | Trends.1 | |
|---|---|---|
| 0 | Daily SMA20 | 16.9708 |
| 1 | Daily SMA50 | 17.2566 |
| 2 | Daily SMA100 | 17.7063 |
| 3 | Daily SMA200 | 18.4506 |
The previous day high was 17.0097 while the previous day low was 16.8129. The daily 38.2% Fib levels comes at 16.888, expected to provide resistance. Similarly, the daily 61.8% fib level is at 16.9345, expected to provide resistance.
Note the levels of interest below:
- Pivot support is noted at 16.7589, 16.6875, 16.5621
- Pivot resistance is noted at 16.9557, 17.0811, 17.1525
| Levels | Levels.1 |
|---|---|
| Previous Daily High | 17.0097 |
| Previous Daily Low | 16.8129 |
| Previous Weekly High | 17.0512 |
| Previous Weekly Low | 16.6924 |
| Previous Monthly High | 17.7286 |
| Previous Monthly Low | 17.0243 |
| Daily Fibonacci 38.2% | 16.8880 |
| Daily Fibonacci 61.8% | 16.9345 |
| Daily Pivot Point S1 | 16.7589 |
| Daily Pivot Point S2 | 16.6875 |
| Daily Pivot Point S3 | 16.5621 |
| Daily Pivot Point R1 | 16.9557 |
| Daily Pivot Point R2 | 17.0811 |
| Daily Pivot Point R3 | 17.1525 |
[/s2If]
Download Nehcap EAWe have two EAs that are operational on our LIVE accounts.
- EA-FIX: Check out the details here. Download EA-FIX . EA-FIX is a non-grid HFT scalper.
- EA-GROWTH: High quality low dd EA using trend grids. Download EA_GROWTHJoin Our Telegram Group
")


