The USDCHF currency pair decreases slightly on Tuesday, with a modest decline in the value of the USD putting pressure on it.
…
This is a premium post.
[s2If !current_user_can(access_s2member_level4)]Please register for FREE REGISTER to read full post below containing analysis. In case of any error or you think you are not able to read the full post below, please email us at support#nehcap.com [lwa][/s2If] [s2If current_user_can(access_s2member_level1)]
- USD/CHF edges lower on Tuesday and is pressured by a modest USD downtick.
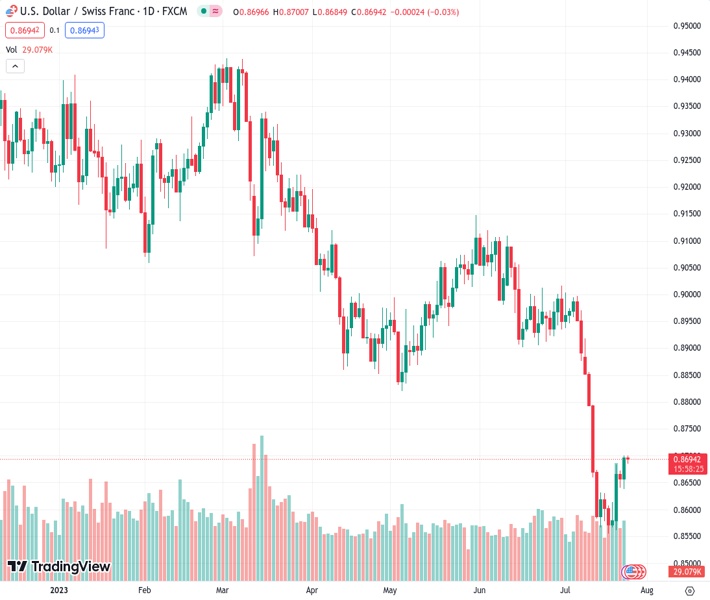
The pair currently trades last at 0.86948.
The previous day high was 0.87 while the previous day low was 0.8638. The daily 38.2% Fib levels comes at 0.8676, expected to provide support. Similarly, the daily 61.8% fib level is at 0.8661, expected to provide support.
The USD/CHF pair faces rejection near the 0.8700 mark and retreats a few pips from a nearly two-week high touched during the Asian session earlier this Tuesday. Spot prices currently trade around the 0.8685 region, down 0.10% for the day, and the modest intraday downtick is sponsored by a mildly softer tone surrounding the US Dollar (USD).
In fact, the USD Index (DXY), which tracks the Greenback against a basket of currencies, now seems to have stalled a one-week-old recovery trend from its lowest level since April 2022 touched last week. Traders, however, might refrain from placing aggressive USD bearish bets and prefer to wait for fresh cues about the Federal Reserve’s (Fed) future rate-hike path. Apart from this, the prevalent risk-on mood could undermine the safe-haven Swiss Franc (CHF) and further contribute to limiting the downside for the USD/CHF pair, at least for the time being.
It is worth mentioning that the markets have been pricing out the possibility of any further rate hikes after the widely expected 25 bps lift-off at the end of a two-day FOMC policy meeting on Wednesday. Investors, however, remain sceptic if the US central bank will commit to a more dovish policy stance or stick to its forecast for a 50 bps rate hike by the end of this year. Hence, the focus will be on the accompanying policy statement and Fed Chair Jerome Powell’s remarks. The outlook, in turn, will play a key role in influencing the near-term USD price dynamics.
In the meantime, the latest optimism over additional stimulus measures from China remains supportive of the risk-on rally across the Asian equity markets. State news agency Xinhua cited the Politburo – the top decision-making body of the ruling Communist Party – saying that China will step up economic policy adjustments, focusing on expanding domestic demand, boosting confidence and preventing risks. This could drive flows away from traditional safe-haven currencies, including the CHF, and warrants caution before placing bearish bets around the USD/CHF pair.
Market participants now look to the US macro data – the Conference Board’s Consumer Confidence Index and the Richmond Fed Manufacturing Index – for some impetus later during the early North American session. This week’s rather packed US economic docket also features the Advance Q2 GDP print and the Core PCE Price Index (the Fed’s preferred inflation gauge), which should help determine the next leg of a directional move for the USD/CHF pair. Hence, strong follow-through selling is needed to confirm that the recent bounce from a multi-year low has run out of steam.
Technical Levels: Supports and Resistances
USDCHF currently trading at 0.8689 at the time of writing. Pair opened at 0.8697 and is trading with a change of -0.09 % .
| Overview | Overview.1 | |
|---|---|---|
| 0 | Today last price | 0.8689 |
| 1 | Today Daily Change | -0.0008 |
| 2 | Today Daily Change % | -0.0900 |
| 3 | Today daily open | 0.8697 |
The pair remains strongly bearish on the daily time frame. It trades below the 20 SMA @ 0.8797, 50 SMA 0.8929, 100 SMA @ 0.8996 and 200 SMA @ 0.9212.
| Trends | Trends.1 | |
|---|---|---|
| 0 | Daily SMA20 | 0.8797 |
| 1 | Daily SMA50 | 0.8929 |
| 2 | Daily SMA100 | 0.8996 |
| 3 | Daily SMA200 | 0.9212 |
The previous day high was 0.87 while the previous day low was 0.8638. The daily 38.2% Fib levels comes at 0.8676, expected to provide support. Similarly, the daily 61.8% fib level is at 0.8661, expected to provide support.
Note the levels of interest below:
- Pivot support is noted at 0.8656, 0.8616, 0.8594
- Pivot resistance is noted at 0.8719, 0.8741, 0.8781
| Levels | Levels.1 |
|---|---|
| Previous Daily High | 0.8700 |
| Previous Daily Low | 0.8638 |
| Previous Weekly High | 0.8684 |
| Previous Weekly Low | 0.8555 |
| Previous Monthly High | 0.9120 |
| Previous Monthly Low | 0.8902 |
| Daily Fibonacci 38.2% | 0.8676 |
| Daily Fibonacci 61.8% | 0.8661 |
| Daily Pivot Point S1 | 0.8656 |
| Daily Pivot Point S2 | 0.8616 |
| Daily Pivot Point S3 | 0.8594 |
| Daily Pivot Point R1 | 0.8719 |
| Daily Pivot Point R2 | 0.8741 |
| Daily Pivot Point R3 | 0.8781 |
[/s2If]
Download Nehcap EAWe have two EAs that are operational on our LIVE accounts.
- EA-FIX: Check out the details here. Download EA-FIX . EA-FIX is a non-grid HFT scalper.
- EA-GROWTH: High quality low dd EA using trend grids. Download EA_GROWTHJoin Our Telegram Group
")


