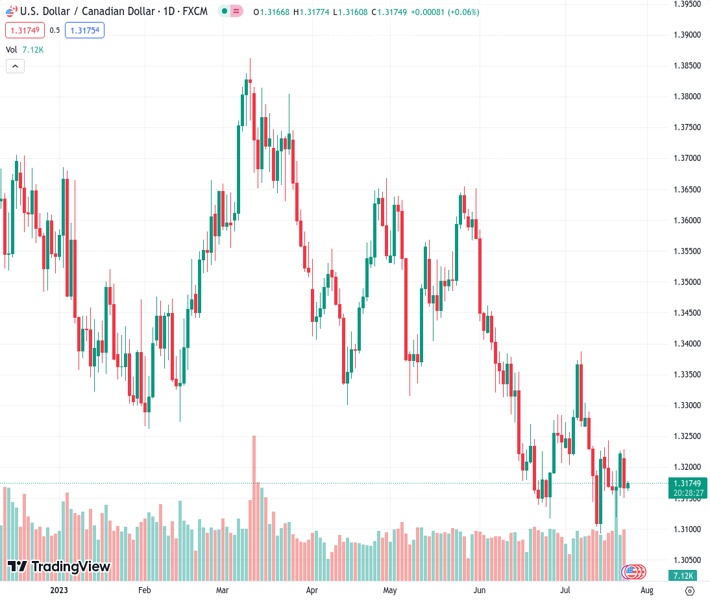
The pair USDCAD, currently trading at 1.31743, has attracted buyers in order to stabilize after experiencing its largest daily decline in more than a week.
…
This is a premium post.
[s2If !current_user_can(access_s2member_level4)]Please register for FREE REGISTER to read full post below containing analysis. In case of any error or you think you are not able to read the full post below, please email us at support#nehcap.com [lwa][/s2If] [s2If current_user_can(access_s2member_level1)]
- USD/CAD picks up bids to consolidate the biggest daily loss in over a week.
The pair currently trades last at 1.31743.
The previous day high was 1.3229 while the previous day low was 1.315. The daily 38.2% Fib levels comes at 1.318, expected to provide resistance. Similarly, the daily 61.8% fib level is at 1.3199, expected to provide resistance.
USD/CAD licks its wounds near 1.3175-80 after marking the biggest daily loss in eight days. In doing so, the Loonie pair justifies the latest retreat in the WTI crude oil price, Canada’s key export item, as well as the firmer US Dollar, amid a sluggish Tuesday morning in Asia.
USD/CAD ignored the US Dollar bulls, as well as the Bank of Canada (BoC) survey, amid a rally in the WTI crude oil price to refresh the three-month high. However, the market’s reassessment of the oil fundamentals and cautious mood ahead of Wednesday’s Federal Open Market Committee (FOMC) monetary policy meeting announcements prod the Loonie pair sellers of late.
On Monday, Reuters reported the latest Bank of Canada (BoC) survey showing that most market participants expect the BoC to hold its policy rate at 5% until the end of 2023. The poll also mentioned that the median of the participants forecast the BoC to reduce the key interest rate to 3.50% in the fourth quarter of 2024.
On the other hand, the US Dollar Index (DXY) refreshed a two-week high near 101.40 during a five-day uptrend, mildly bid near 101.45 by the press time, amid comparatively better PMI data and upbeat yields. That said, the first readings of the US S&P Global Manufacturing PMI for July improved to 49.0 from 46.3 prior and 46.4 market forecasts while the Services PMI eased to 52.4 versus 54.0 expected and 54.4 previous readings. With this, the Composite PMI edged lower to 52.0 from 53.2 prior and 53.1 market forecasts. However, Chicago Fed National Activity Index for June slid to -0.32 from -0.28 prior (revised) and 0.03 market forecasts.
It should be noted that the overall weakness in the global PMIs bolstered market sentiment amid hopes of witnessing an end to the tightening cycle at the major central banks, which in turn allowed the WTI crude oil to remain firmer amid supply crunch fears. Also favoring the oil buyers were hopes of more stimulus from China and concerns that the US will buy more oil to refill its Strategic Petroleum Reserves (SPR). On the same line are chatters that the energy markets will remain tighter in late 2023. Amid these plays, the WTI crude oil jumped the most in six weeks to refresh the highest levels in three months to around $79.25, down 0.11% intraday near $78.75 by the press time.
Looking ahead, the US CB Consumer Confidence for July, expected at 112.1 versus 109.70 prior, will entertain the USD/CAD traders but major attention will be given to the Oil price and the market’s Fed bets for clear directions.
USD/CAD recovery remains elusive unless providing a daily closing beyond the 21-DMA hurdle of around 1.3220. The downward trajectory, however, should conquer the one-week-old rising support line, close to 1.3140 at the latest, to recall the Loonie pair sellers.
Technical Levels: Supports and Resistances
USDCAD currently trading at 1.3176 at the time of writing. Pair opened at 1.3168 and is trading with a change of 0.06% % .
| Overview | Overview.1 | |
|---|---|---|
| 0 | Today last price | 1.3176 |
| 1 | Today Daily Change | 0.0008 |
| 2 | Today Daily Change % | 0.06% |
| 3 | Today daily open | 1.3168 |
The pair remains strongly bearish on the daily time frame. It trades below the 20 SMA @ 1.3223, 50 SMA 1.3327, 100 SMA @ 1.3447 and 200 SMA @ 1.3474.
| Trends | Trends.1 | |
|---|---|---|
| 0 | Daily SMA20 | 1.3223 |
| 1 | Daily SMA50 | 1.3327 |
| 2 | Daily SMA100 | 1.3447 |
| 3 | Daily SMA200 | 1.3474 |
The previous day high was 1.3229 while the previous day low was 1.315. The daily 38.2% Fib levels comes at 1.318, expected to provide resistance. Similarly, the daily 61.8% fib level is at 1.3199, expected to provide resistance.
Note the levels of interest below:
- Pivot support is noted at 1.3136, 1.3104, 1.3057
- Pivot resistance is noted at 1.3214, 1.3261, 1.3293
| Levels | Levels.1 |
|---|---|
| Previous Daily High | 1.3229 |
| Previous Daily Low | 1.3150 |
| Previous Weekly High | 1.3244 |
| Previous Weekly Low | 1.3120 |
| Previous Monthly High | 1.3585 |
| Previous Monthly Low | 1.3117 |
| Daily Fibonacci 38.2% | 1.3180 |
| Daily Fibonacci 61.8% | 1.3199 |
| Daily Pivot Point S1 | 1.3136 |
| Daily Pivot Point S2 | 1.3104 |
| Daily Pivot Point S3 | 1.3057 |
| Daily Pivot Point R1 | 1.3214 |
| Daily Pivot Point R2 | 1.3261 |
| Daily Pivot Point R3 | 1.3293 |
[/s2If]
Download Nehcap EAWe have two EAs that are operational on our LIVE accounts.
- EA-FIX: Check out the details here. Download EA-FIX . EA-FIX is a non-grid HFT scalper.
- EA-GROWTH: High quality low dd EA using trend grids. Download EA_GROWTHJoin Our Telegram Group
")


