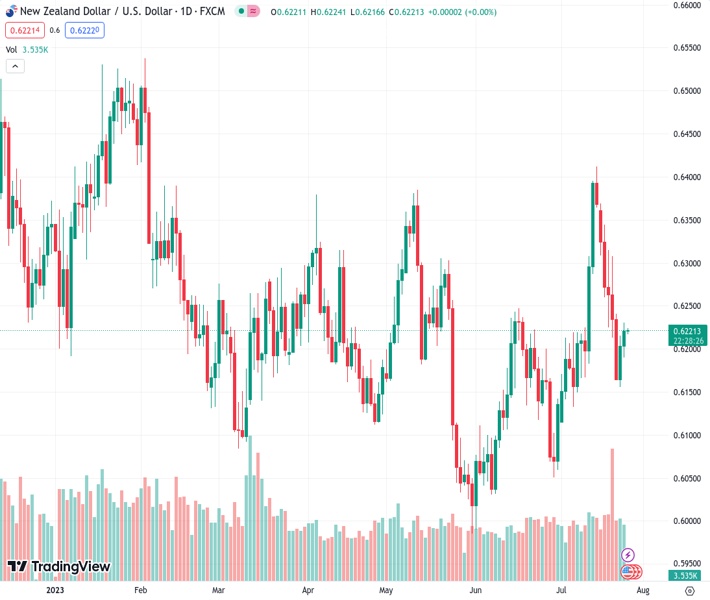
The NZDUSD currency pair is currently at 0.62209 and the bullish momentum has paused following two consecutive days of gains.
…
This is a premium post.
[s2If !current_user_can(access_s2member_level4)]Please register for FREE REGISTER to read full post below containing analysis. In case of any error or you think you are not able to read the full post below, please email us at support#nehcap.com [lwa][/s2If] [s2If current_user_can(access_s2member_level1)]
- NZD/USD bulls take a breather after two-day winning streak.
The pair currently trades last at 0.62209.
The previous day high was 0.6216 while the previous day low was 0.6156. The daily 38.2% Fib levels comes at 0.6193, expected to provide support. Similarly, the daily 61.8% fib level is at 0.6179, expected to provide support.
NZD/USD remains on the front foot around 0.6220 despite the latest pre-Fed inaction amid early Wednesday morning in Asia. That said, the Kiwi pair rose in the last two consecutive days amid a risk-on mood and the US Dollar’s pullback ahead of the key Federal Open Market Committee (FOMC) monetary policy meeting announcements.
Chinese policymakers’ signal for another round of heavy stimulus to defend the world’s second-largest economy from losing the post-COVID recovery seemed to have favored the market sentiment, especially in the Asia-Pacific zone on Tuesday. On the same line could be the recently downbeat statistics from the major economies which flag the end of the rate hike trajectory at the key central banks. Furthermore, the International Monetary Fund’s (IMF) upward revision to the global growth forecasts also helped improve the market sentiment and the NZD/USD price.
With the risk-on mood dimming the US Dollar’s haven demand, the greenback dropped the previous day. Apart from the firmer sentiment, Reuters’ news stating China state banks’ defense of the Yuan (CNY), by selling the US Dollar, also seemed to have weighed on the US Dollar. That said, the US Dollar Index (DXY) reversed from a two-week high by falling to 101.26 at the latest.
While portraying the mood, Wall Street benchmarks closed on the positive side for the second consecutive day while the US 10-year Treasury bond yields rose to the highest levels in three weeks before ending Tuesday’s trading near 3.89%.
Talking about the US data, US Conference Board (CB) Consumer Confidence jumped to 117.0 for July from 110.10 prior (revised) versus market forecasts of 112.10. The survey details unveiled that the one-year consumer inflation expectations edged lower to 5.7% while the Present Situation Index and Consumer Expectations Index rose to 160.0 and 88.3 in that orders for the said month. That said, the US Housing Price Index for May reprinted the 0.7% MoM growth compared to analysts’ estimation of 0.2% whereas the S&P/Case-Shiller Home Price Indices also repeated the -1.7% YoY figures for the said month versus -2.2% expected.
Looking ahead, a light calendar at home and the pre-Fed anxiety may allow the NZD/USD pair to consolidate the recent gains. However, Australia’s headline Consumer Price Index (CPI) data for June, as well as for the second quarter (Q2), can join the risk catalysts to entertain the Kiwi pair.
A daily closing beyond an eight-day-old descending resistance line, now immediate support around 0.6200, directs NZD/USD prices towards June’s high of near 0.6250. That said, the 50-DMA level of near 0.6170 acts as a strong downside support to watch for the quote’s weakness past 0.6200.
Technical Levels: Supports and Resistances
NZDUSD currently trading at 0.6219 at the time of writing. Pair opened at 0.6204 and is trading with a change of 0.24% % .
| Overview | Overview.1 | |
|---|---|---|
| 0 | Today last price | 0.6219 |
| 1 | Today Daily Change | 0.0015 |
| 2 | Today Daily Change % | 0.24% |
| 3 | Today daily open | 0.6204 |
The pair remains strongly bullish on the daily timeframe. It trades above its 20 SMA @ 0.6212, 50 SMA 0.6169, 100 SMA @ 0.6195 and 200 SMA @ 0.6209.
| Trends | Trends.1 | |
|---|---|---|
| 0 | Daily SMA20 | 0.6212 |
| 1 | Daily SMA50 | 0.6169 |
| 2 | Daily SMA100 | 0.6195 |
| 3 | Daily SMA200 | 0.6209 |
The previous day high was 0.6216 while the previous day low was 0.6156. The daily 38.2% Fib levels comes at 0.6193, expected to provide support. Similarly, the daily 61.8% fib level is at 0.6179, expected to provide support.
Note the levels of interest below:
- Pivot support is noted at 0.6168, 0.6132, 0.6108
- Pivot resistance is noted at 0.6228, 0.6252, 0.6288
| Levels | Levels.1 |
|---|---|
| Previous Daily High | 0.6216 |
| Previous Daily Low | 0.6156 |
| Previous Weekly High | 0.6370 |
| Previous Weekly Low | 0.6163 |
| Previous Monthly High | 0.6250 |
| Previous Monthly Low | 0.5990 |
| Daily Fibonacci 38.2% | 0.6193 |
| Daily Fibonacci 61.8% | 0.6179 |
| Daily Pivot Point S1 | 0.6168 |
| Daily Pivot Point S2 | 0.6132 |
| Daily Pivot Point S3 | 0.6108 |
| Daily Pivot Point R1 | 0.6228 |
| Daily Pivot Point R2 | 0.6252 |
| Daily Pivot Point R3 | 0.6288 |
[/s2If]
Download Nehcap EAWe have two EAs that are operational on our LIVE accounts.
- EA-FIX: Check out the details here. Download EA-FIX . EA-FIX is a non-grid HFT scalper.
- EA-GROWTH: High quality low dd EA using trend grids. Download EA_GROWTHJoin Our Telegram Group
")


