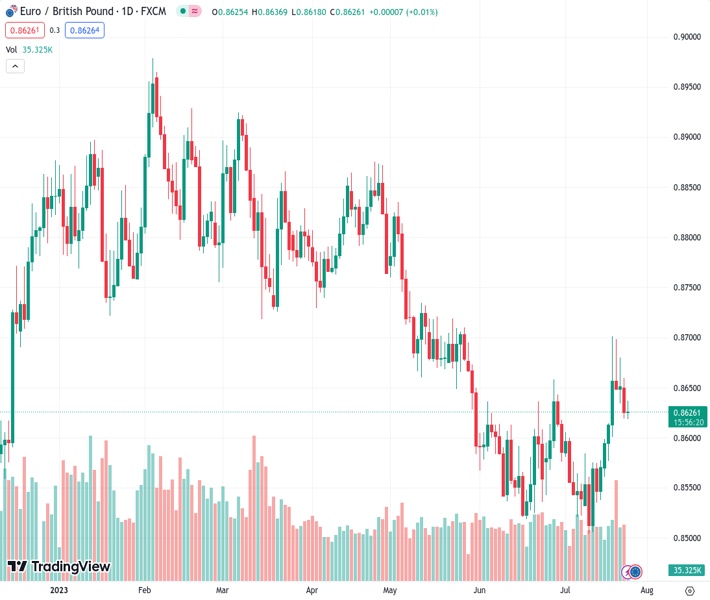
The EUR to GBP exchange rate, currently at 0.86270, is remaining stagnant after experiencing its largest decline in two weeks the day before.
…
This is a premium post.
[s2If !current_user_can(access_s2member_level4)]Please register for FREE REGISTER to read full post below containing analysis. In case of any error or you think you are not able to read the full post below, please email us at support#nehcap.com [lwa][/s2If] [s2If current_user_can(access_s2member_level1)]
- EUR/GBP remains sidelined after declining the most in two weeks the previous day.
The pair currently trades last at 0.86270.
The previous day high was 0.8663 while the previous day low was 0.8619. The daily 38.2% Fib levels comes at 0.8636, expected to provide resistance. Similarly, the daily 61.8% fib level is at 0.8646, expected to provide resistance.
EUR/GBP struggles for clear directions around 0.8630 heading into Tuesday’s European session, licking its wounds near the lowest levels in a week. In doing so, the cross-currency pair prods the bears after witnessing the biggest daily fall in a fortnight amid a cautious mood ahead of the German data.
That said, the quote slumped the previous day after downbeat activity data from Eurozone and Germany flagged fears of a recession in the bloc and pushed back the hawkish bias about the European Central Bank (ECB), even if the 0.25% rate hike is already priced in.
On Monday, the preliminary readings of the Eurozone HCOB Manufacturing PMI slumped to the lowest level since May 2020, to 42.7 for July from 43.4 prior and versus 43.5 market forecasts. That said, the Services PMI also eased to 51.1 for the said month from 52.0 prior and 52.5 expected while the Composite PMI slid to 48.9 from 49.9 previous readings and analysts’ estimations of 49.7. On the same line, German HCOB Manufacturing PMI also dropped to the 38-month low while Services and Composite PMIs declined below the market expectations and previous readings for July.
On the other hand, the preliminary readings of the UK S&P Global/CIPS Manufacturing PMI for July dropped to the lowest level of 2023 with the 45.0 mark versus the market’s expectations of 46.1 and previous readings of 46.5. That said, the Services PMI also printed a six-month low by declining to 51.5 from 53.7 prior and 53.0 market forecasts. With this, the first readings of the Composite PMI edged lower to 50.7 compared to analysts’ estimations of 52.4 and 52.8 prior.
It should be noted that the UK PMIs aren’t too good but the distance from the Bank of England (BoE) Monetary policy meeting and UK PM Rishi Sunak’s announcements of multiple stimulus measures to defend the Tory government seems to put a floor under the British Pound (GBP). Even so, the fears of the UK recession test the EUR/GBP bears.
Looking ahead, the ECB Bank Lending Survey and Germany’s IFO poll details will entertain EUR/GBP traders ahead of Thursday’s ECB Interest Rate Decision.
A clear downside break of two-week-long rising support line, now immediate resistance around 0.8665, direct EUR/GBP bears toward the 50-DMA support of around 0.8600.
Technical Levels: Supports and Resistances
EURGBP currently trading at 0.8628 at the time of writing. Pair opened at 0.8627 and is trading with a change of 0.01% % .
| Overview | Overview.1 | |
|---|---|---|
| 0 | Today last price | 0.8628 |
| 1 | Today Daily Change | 0.0001 |
| 2 | Today Daily Change % | 0.01% |
| 3 | Today daily open | 0.8627 |
The pair is trading above its 20 Daily moving average @ 0.8589, above its 50 Daily moving average @ 0.8605 , below its 100 Daily moving average @ 0.87 and below its 200 Daily moving average @ 0.8729
| Trends | Trends.1 | |
|---|---|---|
| 0 | Daily SMA20 | 0.8589 |
| 1 | Daily SMA50 | 0.8605 |
| 2 | Daily SMA100 | 0.8700 |
| 3 | Daily SMA200 | 0.8729 |
The previous day high was 0.8663 while the previous day low was 0.8619. The daily 38.2% Fib levels comes at 0.8636, expected to provide resistance. Similarly, the daily 61.8% fib level is at 0.8646, expected to provide resistance.
Note the levels of interest below:
- Pivot support is noted at 0.861, 0.8593, 0.8566
- Pivot resistance is noted at 0.8653, 0.868, 0.8697
| Levels | Levels.1 |
|---|---|
| Previous Daily High | 0.8663 |
| Previous Daily Low | 0.8619 |
| Previous Weekly High | 0.8701 |
| Previous Weekly Low | 0.8570 |
| Previous Monthly High | 0.8658 |
| Previous Monthly Low | 0.8518 |
| Daily Fibonacci 38.2% | 0.8636 |
| Daily Fibonacci 61.8% | 0.8646 |
| Daily Pivot Point S1 | 0.8610 |
| Daily Pivot Point S2 | 0.8593 |
| Daily Pivot Point S3 | 0.8566 |
| Daily Pivot Point R1 | 0.8653 |
| Daily Pivot Point R2 | 0.8680 |
| Daily Pivot Point R3 | 0.8697 |
[/s2If]
Download Nehcap EAWe have two EAs that are operational on our LIVE accounts.
- EA-FIX: Check out the details here. Download EA-FIX . EA-FIX is a non-grid HFT scalper.
- EA-GROWTH: High quality low dd EA using trend grids. Download EA_GROWTHJoin Our Telegram Group
")


