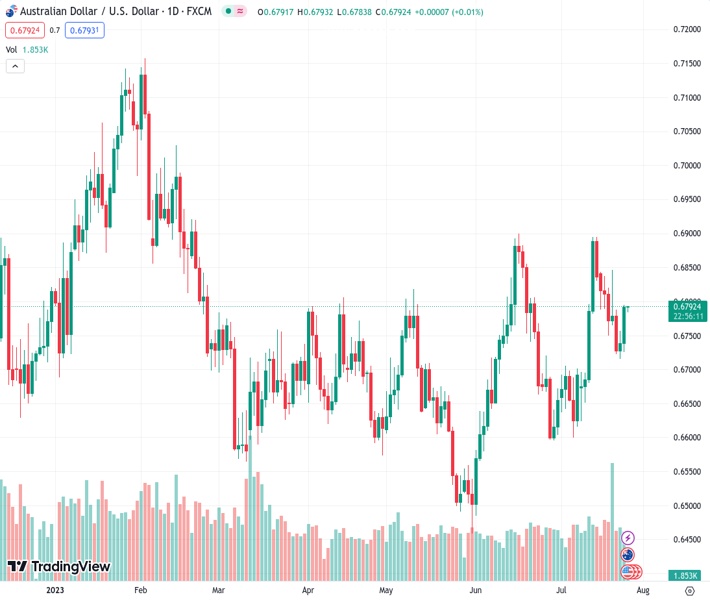
The AUDUSD pair is predicted to experience more gains, indicated by a morning star pattern formed by three consecutive candles. However, the potential for further upward movement may be limited due to upcoming decisions by the Federal Reserve.
…
This is a premium post.
[s2If !current_user_can(access_s2member_level4)]Please register for FREE REGISTER to read full post below containing analysis. In case of any error or you think you are not able to read the full post below, please email us at support#nehcap.com [lwa][/s2If] [s2If current_user_can(access_s2member_level1)]
- Following a three-candle morning star pattern, further upside for the AUD/USD pair is expected, though pending Federal Reserve decisions could hinder this.
The pair currently trades last at 0.67928.
The previous day high was 0.6756 while the previous day low was 0.6715. The daily 38.2% Fib levels comes at 0.674, expected to provide support. Similarly, the daily 61.8% fib level is at 0.6731, expected to provide support.
AUD/USD begins Wednesday’s Asian session with a minimal loss of 0.08% following a positive Tuesday’s session that witnessed the pair gaining 0.78% but failing to climb above the 0.6800 figure after bouncing from a daily low of 0.6725. As of writing, the AUD/USD exchanges hands at 0.6787.
In the last couple of days, after tumbling to a new two-week low of 0.6714, the AUD/USD stages a comeback following the formation of a three-candle morning star, warranting further upside is expected. However, fundamental news, mainly the US Federal Reserve (Fed) monetary policy decision looming, could negate its validity if Fed Chair Jerome Powell and Co. give a hawkish signal that could boost the greenback.
If AUD/USD extends its gains past 0.6800, the next resistance would be the July 20 daily high of 0.6846, followed by the July 14 high of 0.6894. A breach of the latter will expose the February 21 high at 0.6919, followed by the 0.7000 mark.
Conversely, if AUD/USD reverses its course, the first support to test would be the confluence of the 20-and 200-day EMA at around 0.6752/51. Once cleared, the next support would be the July 25 low of 0.6725, followed by the weekly low of 0.6714, with further downside risks emerging at 0.6700,
Technical Levels: Supports and Resistances
AUDUSD currently trading at 0.6789 at the time of writing. Pair opened at 0.6739 and is trading with a change of 0.74 % .
| Overview | Overview.1 | |
|---|---|---|
| 0 | Today last price | 0.6789 |
| 1 | Today Daily Change | 0.0050 |
| 2 | Today Daily Change % | 0.7400 |
| 3 | Today daily open | 0.6739 |
The pair remains strongly bullish on the daily timeframe. It trades above its 20 SMA @ 0.6721, 50 SMA 0.6692, 100 SMA @ 0.6687 and 200 SMA @ 0.672.
| Trends | Trends.1 | |
|---|---|---|
| 0 | Daily SMA20 | 0.6721 |
| 1 | Daily SMA50 | 0.6692 |
| 2 | Daily SMA100 | 0.6687 |
| 3 | Daily SMA200 | 0.6720 |
The previous day high was 0.6756 while the previous day low was 0.6715. The daily 38.2% Fib levels comes at 0.674, expected to provide support. Similarly, the daily 61.8% fib level is at 0.6731, expected to provide support.
Note the levels of interest below:
- Pivot support is noted at 0.6718, 0.6696, 0.6676
- Pivot resistance is noted at 0.6759, 0.6778, 0.68
| Levels | Levels.1 |
|---|---|
| Previous Daily High | 0.6756 |
| Previous Daily Low | 0.6715 |
| Previous Weekly High | 0.6854 |
| Previous Weekly Low | 0.6722 |
| Previous Monthly High | 0.6900 |
| Previous Monthly Low | 0.6484 |
| Daily Fibonacci 38.2% | 0.6740 |
| Daily Fibonacci 61.8% | 0.6731 |
| Daily Pivot Point S1 | 0.6718 |
| Daily Pivot Point S2 | 0.6696 |
| Daily Pivot Point S3 | 0.6676 |
| Daily Pivot Point R1 | 0.6759 |
| Daily Pivot Point R2 | 0.6778 |
| Daily Pivot Point R3 | 0.6800 |
[/s2If]
Download Nehcap EAWe have two EAs that are operational on our LIVE accounts.
- EA-FIX: Check out the details here. Download EA-FIX . EA-FIX is a non-grid HFT scalper.
- EA-GROWTH: High quality low dd EA using trend grids. Download EA_GROWTHJoin Our Telegram Group
")


