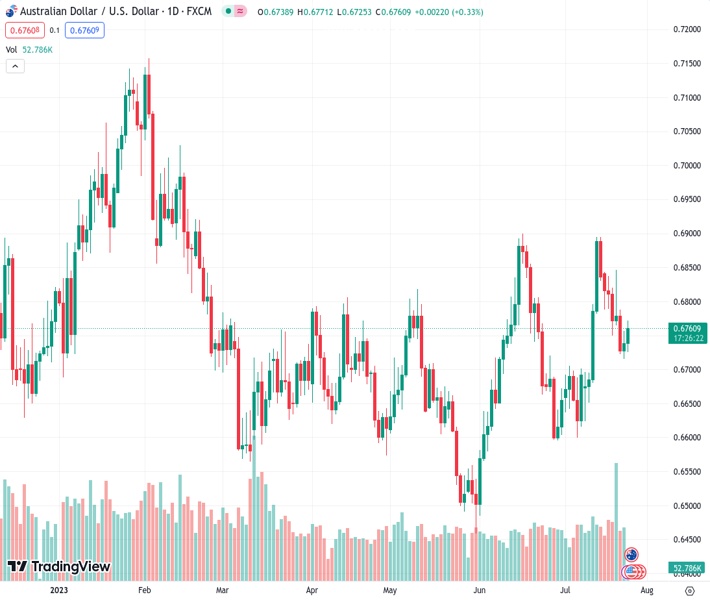
The AUDUSD pair experienced significant upward movement on Tuesday due to a convergence of various contributing factors.
…
This is a premium post.
[s2If !current_user_can(access_s2member_level4)]Please register for FREE REGISTER to read full post below containing analysis. In case of any error or you think you are not able to read the full post below, please email us at support#nehcap.com [lwa][/s2If] [s2If current_user_can(access_s2member_level1)]
- A combination of factors assists AUD/USD to gain strong positive traction on Tuesday.
The pair currently trades last at 0.67594.
The previous day high was 0.6756 while the previous day low was 0.6715. The daily 38.2% Fib levels comes at 0.674, expected to provide support. Similarly, the daily 61.8% fib level is at 0.6731, expected to provide support.
The AUD/USD pair attracts fresh buying following the Asian session dip back closer to a technically significant 200-day Simple Moving Average (SMA) and turns positive for the second successive day on Tuesday. Spot prices recover further from over a one-week low touched on Monday and currently trade around the 0.6765-0.6770 region, up just over 0.40% for the day.
The latest optimism over additional stimulus measures from China remains supportive of the risk-on rally across the Asian equity markets and benefits the risk-sensitive Australian Dollar (AUD). State news agency Xinhua cited the Politburo – the top decision-making body of the ruling Communist Party – saying that China will step up economic policy adjustments, focusing on expanding domestic demand, boosting confidence and preventing risks. This, along with a modest US Dollar (USD) downtick, is seen as another factor pushing the AUD/USD pair higher.
In fact, the USD Index (DXY), which tracks the Greenback against a basket of currencies, pulls back from a two-week high and for now, seems to stalled a five-day-old recovery move from its lowest level since April 2022 touched last week. The USD downtick could be solely attributed to some profit-taking and is likely to remain limited as traders keenly await fresh cues on the Federal Reserve’s (Fed) future rate-hike path. Hence, the focus remains on the outcome of the highly-anticipated two-day FOMC monetary policy meeting, due to be announced on Wednesday.
The Fed is widely expected to hike interest rates by 25 bps points. Market participants, however, remain sceptic if the US central bank will commit to a more dovish policy stance or stick to its forecast for a 50 bps rate hike by the end of this year. This, in turn, suggests that investors will closely scrutinized the accompanying policy statement and Fed Chair Jerome Powell’s remarks to judge the central bank’s outlook. This will play a key role in influencing the near-term USD price dynamics and help in determining the next leg of a directional move for the AUD/USD pair.
In the meantime, Tuesday’s release of the Conference Board’s US Consumer Confidence Index and Richmond Manufacturing Index might provide some impetus later during the early North American session. The market attention will then turn to the quarterly Australian consumer inflation figures, due on Wednesday. This week’s busy economic docket also highlights the Advance US Q2 GDP print and the Fed’s preferred inflation gauge – the Core PCE Price Index. The crucial central bank event risks, along with the key macro data, should infuse some volatility around the AD/USD pair.
Technical Levels: Supports and Resistances
AUDUSD currently trading at 0.6764 at the time of writing. Pair opened at 0.6739 and is trading with a change of 0.37 % .
| Overview | Overview.1 | |
|---|---|---|
| 0 | Today last price | 0.6764 |
| 1 | Today Daily Change | 0.0025 |
| 2 | Today Daily Change % | 0.3700 |
| 3 | Today daily open | 0.6739 |
The pair remains strongly bullish on the daily timeframe. It trades above its 20 SMA @ 0.6721, 50 SMA 0.6692, 100 SMA @ 0.6687 and 200 SMA @ 0.672.
| Trends | Trends.1 | |
|---|---|---|
| 0 | Daily SMA20 | 0.6721 |
| 1 | Daily SMA50 | 0.6692 |
| 2 | Daily SMA100 | 0.6687 |
| 3 | Daily SMA200 | 0.6720 |
The previous day high was 0.6756 while the previous day low was 0.6715. The daily 38.2% Fib levels comes at 0.674, expected to provide support. Similarly, the daily 61.8% fib level is at 0.6731, expected to provide support.
Note the levels of interest below:
- Pivot support is noted at 0.6718, 0.6696, 0.6676
- Pivot resistance is noted at 0.6759, 0.6778, 0.68
| Levels | Levels.1 |
|---|---|
| Previous Daily High | 0.6756 |
| Previous Daily Low | 0.6715 |
| Previous Weekly High | 0.6854 |
| Previous Weekly Low | 0.6722 |
| Previous Monthly High | 0.6900 |
| Previous Monthly Low | 0.6484 |
| Daily Fibonacci 38.2% | 0.6740 |
| Daily Fibonacci 61.8% | 0.6731 |
| Daily Pivot Point S1 | 0.6718 |
| Daily Pivot Point S2 | 0.6696 |
| Daily Pivot Point S3 | 0.6676 |
| Daily Pivot Point R1 | 0.6759 |
| Daily Pivot Point R2 | 0.6778 |
| Daily Pivot Point R3 | 0.6800 |
[/s2If]
Download Nehcap EAWe have two EAs that are operational on our LIVE accounts.
- EA-FIX: Check out the details here. Download EA-FIX . EA-FIX is a non-grid HFT scalper.
- EA-GROWTH: High quality low dd EA using trend grids. Download EA_GROWTHJoin Our Telegram Group
")


