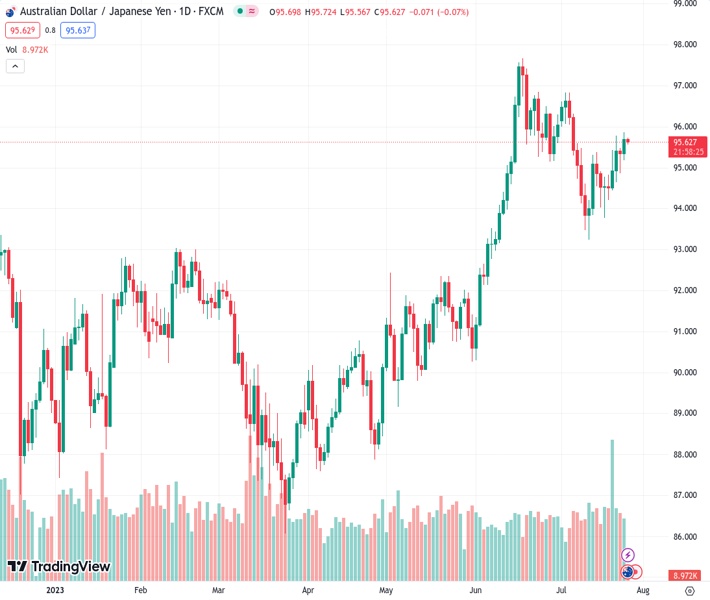
The AUDJPY pair has reached a resistance at the 96.00 level, causing it to temporarily stop its upward movement. It had previously surged to a new three-week high at 95.86.
…
This is a premium post.
[s2If !current_user_can(access_s2member_level4)]Please register for FREE REGISTER to read full post below containing analysis. In case of any error or you think you are not able to read the full post below, please email us at support#nehcap.com [lwa][/s2If] [s2If current_user_can(access_s2member_level1)]
- AUD/JPY stalls ahead of breaching the 96.00 level after rallying to a new three-week high at 95.86.
The pair currently trades last at 95.6220.
The previous day high was 95.53 while the previous day low was 94.88. The daily 38.2% Fib levels comes at 95.12, expected to provide support. Similarly, the daily 61.8% fib level is at 95.28, expected to provide support.
AUD/JPY rallies to a new three-week high at 95.86, yet stalls ahead of breaching the 96.00 figure, at around 95.86, following an upside break of the Kijun-Sen line. Hence, the AUD/JPY has resumed its uptrend and trades at 95.66, almost flat as the Asian session begins.
The AUD/JPY uptrend remains intact but faces strong resistance at around 96.00. Traders are bracing for the US Federal Reserve (fed) monetary policy later at around 18:00 GMT and also for the Australian inflation figures, which could trigger a reaction in the pair,
If the AUD/JPY breaks the first resistance at 96.00, the next ceiling level would be the July 5 high at 96.83 before hitting 97.00. Once that level is cleared, the AUD/JPY would be poised to test the year-to-date (YTD) high of 97.67.
Conversely, if AUD/JPY retreats below the July 10 high turned support at 95.47, the pair would accelerate its fall toward the Kijun-Sen line at 95.03 before dipping below the 95.00 figure. Next support emerges at the Tenkan- Sen line at 94.82 as the key support level.
Technical Levels: Supports and Resistances
AUDJPY currently trading at 95.68 at the time of writing. Pair opened at 95.34 and is trading with a change of 0.36 % .
| Overview | Overview.1 | |
|---|---|---|
| 0 | Today last price | 95.68 |
| 1 | Today Daily Change | 0.34 |
| 2 | Today Daily Change % | 0.36 |
| 3 | Today daily open | 95.34 |
The pair remains strongly bullish on the daily timeframe. It trades above its 20 SMA @ 95.27, 50 SMA 94.18, 100 SMA @ 91.78 and 200 SMA @ 91.93.
| Trends | Trends.1 | |
|---|---|---|
| 0 | Daily SMA20 | 95.27 |
| 1 | Daily SMA50 | 94.18 |
| 2 | Daily SMA100 | 91.78 |
| 3 | Daily SMA200 | 91.93 |
The previous day high was 95.53 while the previous day low was 94.88. The daily 38.2% Fib levels comes at 95.12, expected to provide support. Similarly, the daily 61.8% fib level is at 95.28, expected to provide support.
Note the levels of interest below:
- Pivot support is noted at 94.97, 94.6, 94.32
- Pivot resistance is noted at 95.62, 95.9, 96.28
| Levels | Levels.1 |
|---|---|
| Previous Daily High | 95.53 |
| Previous Daily Low | 94.88 |
| Previous Weekly High | 95.79 |
| Previous Weekly Low | 93.78 |
| Previous Monthly High | 97.68 |
| Previous Monthly Low | 90.30 |
| Daily Fibonacci 38.2% | 95.12 |
| Daily Fibonacci 61.8% | 95.28 |
| Daily Pivot Point S1 | 94.97 |
| Daily Pivot Point S2 | 94.60 |
| Daily Pivot Point S3 | 94.32 |
| Daily Pivot Point R1 | 95.62 |
| Daily Pivot Point R2 | 95.90 |
| Daily Pivot Point R3 | 96.28 |
[/s2If]
Download Nehcap EAWe have two EAs that are operational on our LIVE accounts.
- EA-FIX: Check out the details here. Download EA-FIX . EA-FIX is a non-grid HFT scalper.
- EA-GROWTH: High quality low dd EA using trend grids. Download EA_GROWTHJoin Our Telegram Group
")


