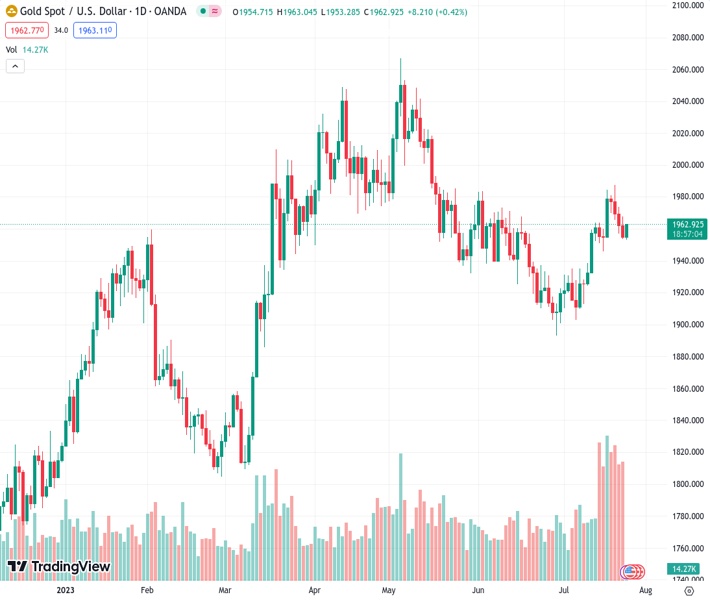
Gold price saw some purchasing activity on Tuesday and ended a four-day decline, reaching its lowest point in a week.
…
This is a premium post.
[s2If !current_user_can(access_s2member_level4)]Please register for FREE REGISTER to read full post below containing analysis. In case of any error or you think you are not able to read the full post below, please email us at support#nehcap.com [lwa][/s2If] [s2If current_user_can(access_s2member_level1)]
- Gold price attracts some buying on Tuesday and snaps a four-day losing streak to a one-week low.
The pair currently trades last at 1962.56.
The previous day high was 1967.94 while the previous day low was 1953.53. The daily 38.2% Fib levels comes at 1959.03, expected to provide support. Similarly, the daily 61.8% fib level is at 1962.44, expected to provide support.
Gold price gains some positive traction during the Asian session on Tuesday and for now, seems to have snapped a four-day losing streak to over a one-week low touched the previous day. The XAU/USD currently trades around the $1,960 level, up 0.25% for the day, as traders keenly wait this week’s key central bank event risks.
Looming recession risks, the worsening relations between the United States (US) and China – the world’s two largest economies – and geopolitical risks cap the recent optimism in the markets. Worries about a deeper global economic downturn reignited on Monday following the disappointing release of the Purchasing Managers’ Index (PMI) prints for July. The survey showed broad-based decline in business activity across the manufacturing and services sector in the Euro Zone, the United Kingdom (UK) and the United States (US). This, in turn, is seen as a key factor lending some support to the safe-haven Gold price.
Apart from this, a modest US Dollar (USD) pullback from over a two-week top turns out to be another factor underpinning the XAU/USD. The downside for the USD, meanwhile, seems limited ahead of the highly-anticipated Federal Open Market Committee (FOMC) policy meeting, starting this Tuesday. The Federal Reserve (Fed) will announce its decision on Wednesday and is widely anticipated to hike interest rates by 25 basis points (bps). Apart from this, the focus will be on the accompanying monetary policy statement and Fed Chair Jerome Powell’s remarks at the post-meeting press conference.
Investors will look for fresh cues on future rate-hike path, which, in turn, will play a key role in infuencing the USD price dynamics and provide a fresh directional impetus to the US Dolllar-denominated Gold price. In the meantime, skepticism if the Fed will commit to a more dovish policy stance or stick to its forecast for a 50 bps rate hike by the end of this year should allow the USD to presreve the recent strong recovery gains from its lowest level since April 2022 touched last Tuesday. This might hold back traders from placing aggressive directional bets and cap any further gains for the XAU/USD.
Apart from the high-anticipated Fed decision, this week’s rather busy week also features the release of important US macro data, including the Advance Q2 GDP report and the Core PCE Price Index (the Fed’s preferred inflation gauge). Investors will also look to the European Central Bank (ECB) meeting on Thursday, followed by the Bank of Japan (BoJ) monetary policy update on Friday, which should further contribute in determining the near-term trajectory for the non-yielding Gold price. This makes it prudent to wait for some follow-thruogh buying before positioning for any further gains for the XAU/USD.
From a technical perspective, any subsequent strength beyond the 100-day Simple Moving Average (SMA), currently around the $1,.962 area, is likely to confront stiff resistance near the $1,977-$1,978 zone. This is followed by the monthly peak, around the $1,987-$1,988 region set last week, above which the Gold price could aim to reclaim the $2,000 psychological mark. The upward trajectory could get extended further towards the next relevant hurdle near the $2,010-$2,012 supply zone.
On the flip side, the weekly low, around the $1,953 area, now seems to protect the immediate downside ahead of the $1,946-$1,945 region. Some follow-through selling, however, will suggest that the recent upward trajectory witnessed since the beginning of the current month has run its course and pave the way for deeper losses. The Gold price could then accelerate the fall towards the $1,934 horizontal support en route to the $1,926-$1,925 region. The next relevant support is pegged near the $1,909 area, below which the XAU/USD could weaken below the $1,900 mark and retest the multi-month low, around the $1,893-$1,892 area touched in June.
Technical Levels: Supports and Resistances
XAUUSD currently trading at 1959.69 at the time of writing. Pair opened at 1954.7 and is trading with a change of 0.26 % .
| Overview | Overview.1 | |
|---|---|---|
| 0 | Today last price | 1959.69 |
| 1 | Today Daily Change | 4.99 |
| 2 | Today Daily Change % | 0.26 |
| 3 | Today daily open | 1954.70 |
The pair is trading above its 20 Daily moving average @ 1938.72, above its 50 Daily moving average @ 1947.88 , below its 100 Daily moving average @ 1961.77 and above its 200 Daily moving average @ 1881.32
| Trends | Trends.1 | |
|---|---|---|
| 0 | Daily SMA20 | 1938.72 |
| 1 | Daily SMA50 | 1947.88 |
| 2 | Daily SMA100 | 1961.77 |
| 3 | Daily SMA200 | 1881.32 |
The previous day high was 1967.94 while the previous day low was 1953.53. The daily 38.2% Fib levels comes at 1959.03, expected to provide support. Similarly, the daily 61.8% fib level is at 1962.44, expected to provide support.
Note the levels of interest below:
- Pivot support is noted at 1949.51, 1944.31, 1935.1
- Pivot resistance is noted at 1963.92, 1973.13, 1978.33
| Levels | Levels.1 |
|---|---|
| Previous Daily High | 1967.94 |
| Previous Daily Low | 1953.53 |
| Previous Weekly High | 1987.54 |
| Previous Weekly Low | 1945.85 |
| Previous Monthly High | 1983.50 |
| Previous Monthly Low | 1893.01 |
| Daily Fibonacci 38.2% | 1959.03 |
| Daily Fibonacci 61.8% | 1962.44 |
| Daily Pivot Point S1 | 1949.51 |
| Daily Pivot Point S2 | 1944.31 |
| Daily Pivot Point S3 | 1935.10 |
| Daily Pivot Point R1 | 1963.92 |
| Daily Pivot Point R2 | 1973.13 |
| Daily Pivot Point R3 | 1978.33 |
[/s2If]
Download Nehcap EAWe have two EAs that are operational on our LIVE accounts.
- EA-FIX: Check out the details here. Download EA-FIX . EA-FIX is a non-grid HFT scalper.
- EA-GROWTH: High quality low dd EA using trend grids. Download EA_GROWTHJoin Our Telegram Group
")


