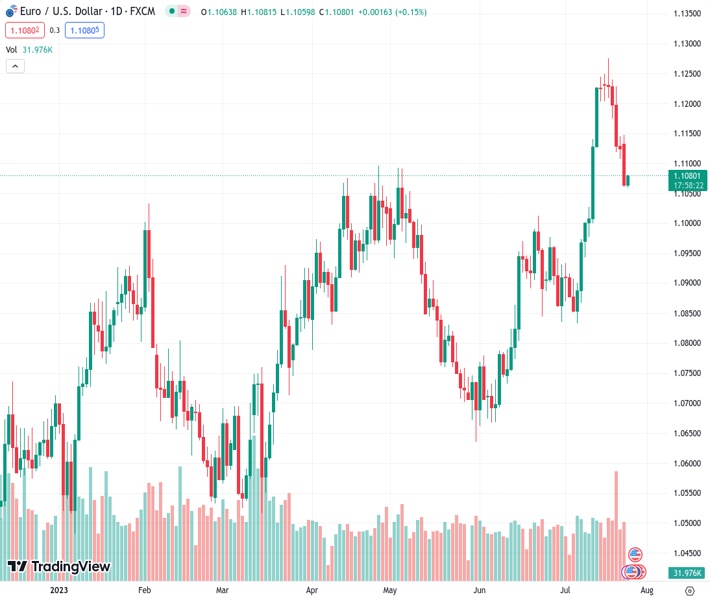
During the Asian session on Tuesday, the EURUSD pair at 1.10806 experiences an increase in demand from buyers. However, this momentum is not sustained.
…
This is a premium post.
[s2If !current_user_can(access_s2member_level4)]Please register for FREE REGISTER to read full post below containing analysis. In case of any error or you think you are not able to read the full post below, please email us at support#nehcap.com [lwa][/s2If] [s2If current_user_can(access_s2member_level1)]
- EUR/USD attracts some buying during the Asian session on Tuesday, albeit lacks follow-through.
The pair currently trades last at 1.10806.
The previous day high was 1.1147 while the previous day low was 1.106. The daily 38.2% Fib levels comes at 1.1093, expected to provide resistance. Similarly, the daily 61.8% fib level is at 1.1114, expected to provide resistance.
The EUR/USD pair edges higher during the Asian session on Tuesday and for now, seems to have snapped a five-day losing streak, stalling its corrective slide from the highest level since February 2022 touched earlier this week. Spot prices, however, lack bullish conviction and currently trade around the 1.1070-1.1075 region, up less than 0.10% for the day.
The US Dollar (USD) ticks down following the recent recovery from a 15-month low witnessed over the past five days and turns out to be a key factor lending some support to the EUR/USD pair. The upside potential, meanwhile, seems limited as traders might refrain from placing aggressive bets ahead of this week’s key central bank event risk – the FOMC policy decision on Wednesday, followed by the European Central Bank (ECB) meeting on Thursday.
From a technical perspective, the EUR/USD pair manages to find some support near the 100-period Simple Moving Average (SMA) on the 4-hour chart. This is closely followed by the mid-1.1000s, representing the 50% Fibonacci retracement level of the rally from the monthly swing low, which if broken decisively should pave the way for further losses. Spot prices might then accelerate the slide towards the 1.1000 psychological mark, or the 61.8% Fibo. level.
Given that oscillators on the daily chart – though have been losing traction – as still holding in the positive territory – the latter should act as a strong base for the EUR/USD pair. That said, a convincing break below will be seen as a fresh trigger for bearish traders and set the stage for an extension of the corrective decline.
On the flip side, the immediate hurdle is pegged near the 1.1100 round figure or the 38.2% Fibo. level, ahead of the 1.1125-1.1130 congestion zone and the 23.6% Fibo. level, around the 1.1165-1.1170 region. A sustained strength beyond will shift the bias back in favour of bullish traders and lift the EUR/USD pair further beyond the 1.1200 mark, towards testing the next relevant barrier near the 1.1250-1.1255 region and the YTD peak, around the 1.1275 area.
Technical Levels: Supports and Resistances
EURUSD currently trading at 1.1076 at the time of writing. Pair opened at 1.1065 and is trading with a change of 0.1 % .
| Overview | Overview.1 | |
|---|---|---|
| 0 | Today last price | 1.1076 |
| 1 | Today Daily Change | 0.0011 |
| 2 | Today Daily Change % | 0.1000 |
| 3 | Today daily open | 1.1065 |
The pair remains strongly bullish on the daily timeframe. It trades above its 20 SMA @ 1.1037, 50 SMA 1.0898, 100 SMA @ 1.0886 and 200 SMA @ 1.0695.
| Trends | Trends.1 | |
|---|---|---|
| 0 | Daily SMA20 | 1.1037 |
| 1 | Daily SMA50 | 1.0898 |
| 2 | Daily SMA100 | 1.0886 |
| 3 | Daily SMA200 | 1.0695 |
The previous day high was 1.1147 while the previous day low was 1.106. The daily 38.2% Fib levels comes at 1.1093, expected to provide resistance. Similarly, the daily 61.8% fib level is at 1.1114, expected to provide resistance.
Note the levels of interest below:
- Pivot support is noted at 1.1034, 1.1004, 1.0948
- Pivot resistance is noted at 1.1121, 1.1178, 1.1208
| Levels | Levels.1 |
|---|---|
| Previous Daily High | 1.1147 |
| Previous Daily Low | 1.1060 |
| Previous Weekly High | 1.1276 |
| Previous Weekly Low | 1.1108 |
| Previous Monthly High | 1.1012 |
| Previous Monthly Low | 1.0662 |
| Daily Fibonacci 38.2% | 1.1093 |
| Daily Fibonacci 61.8% | 1.1114 |
| Daily Pivot Point S1 | 1.1034 |
| Daily Pivot Point S2 | 1.1004 |
| Daily Pivot Point S3 | 1.0948 |
| Daily Pivot Point R1 | 1.1121 |
| Daily Pivot Point R2 | 1.1178 |
| Daily Pivot Point R3 | 1.1208 |
[/s2If]
Download Nehcap EAWe have two EAs that are operational on our LIVE accounts.
- EA-FIX: Check out the details here. Download EA-FIX . EA-FIX is a non-grid HFT scalper.
- EA-GROWTH: High quality low dd EA using trend grids. Download EA_GROWTHJoin Our Telegram Group
")


