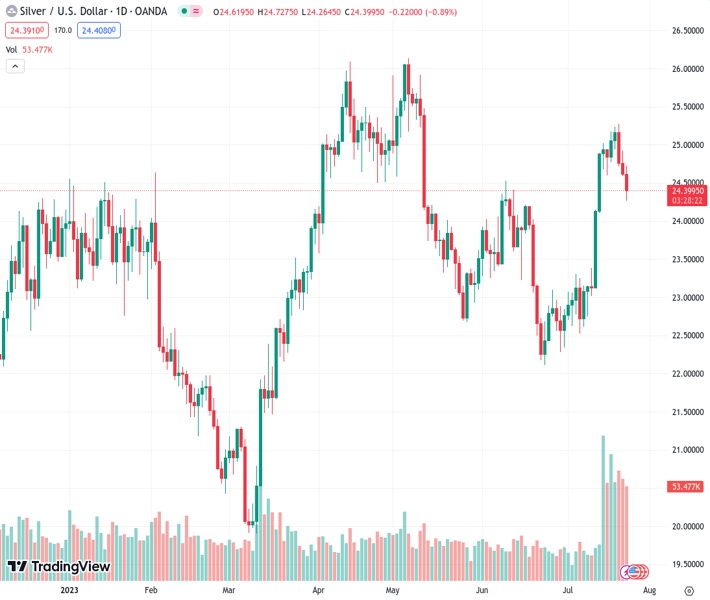
The XAGUSD, currently at 24.401, has experienced a decline for three consecutive days, falling below the $24.50 mark. Additionally, there has been a positive signal as the 20-day and 100-day SMA have intersected in a bullish manner.
…
This is a premium post.
[s2If !current_user_can(access_s2member_level4)]Please register for FREE REGISTER to read full post below containing analysis. In case of any error or you think you are not able to read the full post below, please email us at support#nehcap.com [lwa][/s2If] [s2If current_user_can(access_s2member_level1)]
- XAG/USD dropped for a third consecutive day below $24.50, bullish cross between the 20 and 100-day SMA.
The pair currently trades last at 24.401.
The previous day high was 24.92 while the previous day low was 24.59. The daily 38.2% Fib levels comes at 24.72, expected to provide resistance. Similarly, the daily 61.8% fib level is at 24.79, expected to provide resistance.
At the start of the week, the XAG/USD Silver spot price lost ground as the USD recovery made the grey metal struggle to find demand. The sessions highlights were American and European PMI surveys before the focus shifted to the main central bank monetary policy decisions this week.
German and British Manufacturing and Services PMIs came in lower than expected, while the American indexes came in mixed. The Manufacturing PMI from the US rose to 49 vs the 46.4 expected and the previous 46.3, while the Services Index dropped to 52.4, lower than the 54 expected and the last figure of 54.5.
As a reaction, The US Dollar index (DXY) is trading with gains above 101.00, with American yields seeing little movement. The 2-year yield rose to 4.85%, while the 5 and 10-year rates stand at 4.12% and 3.85%, with mild increases. For Wednesday’s Federal Reserve (Fed) decision, markets expect a 25 basis point announcement but continue to bet on little odds of another hike past July. In that sense, the monetary policy statement followed by Chair Powell’s presser will be closely watched for clues regarding forward guidance.
Regarding Thursday’s European Central Bank (ECB) decision, markets expect a 25 bps hike, while on Friday, investors see the Bank of Japan (BoJ) maintaining its dovish stance.
According to the daily chart, the technical outlook for the XAG/USD is bearish for the short term as indicators took a big hit in the previous sessions. However, traders should eye the 20 and 100-day Simple Moving Average (SMA) movements as they are about to perform a bullish cross at the $23.75 area, which could provide vital support to the grey metal.
Support levels: $24.15, $24.00, $23.75.
Resistance levels: $24.50, $25.00, $25.30.
Technical Levels: Supports and Resistances
XAGUSD currently trading at 24.41 at the time of writing. Pair opened at 24.6 and is trading with a change of -0.77 % .
| Overview | Overview.1 | |
|---|---|---|
| 0 | Today last price | 24.41 |
| 1 | Today Daily Change | -0.19 |
| 2 | Today Daily Change % | -0.77 |
| 3 | Today daily open | 24.60 |
The pair remains strongly bullish on the daily timeframe. It trades above its 20 SMA @ 23.66, 50 SMA 23.58, 100 SMA @ 23.73 and 200 SMA @ 22.91.
| Trends | Trends.1 | |
|---|---|---|
| 0 | Daily SMA20 | 23.66 |
| 1 | Daily SMA50 | 23.58 |
| 2 | Daily SMA100 | 23.73 |
| 3 | Daily SMA200 | 22.91 |
The previous day high was 24.92 while the previous day low was 24.59. The daily 38.2% Fib levels comes at 24.72, expected to provide resistance. Similarly, the daily 61.8% fib level is at 24.79, expected to provide resistance.
Note the levels of interest below:
- Pivot support is noted at 24.49, 24.38, 24.16
- Pivot resistance is noted at 24.82, 25.03, 25.15
| Levels | Levels.1 |
|---|---|
| Previous Daily High | 24.92 |
| Previous Daily Low | 24.59 |
| Previous Weekly High | 25.27 |
| Previous Weekly Low | 24.59 |
| Previous Monthly High | 24.53 |
| Previous Monthly Low | 22.11 |
| Daily Fibonacci 38.2% | 24.72 |
| Daily Fibonacci 61.8% | 24.79 |
| Daily Pivot Point S1 | 24.49 |
| Daily Pivot Point S2 | 24.38 |
| Daily Pivot Point S3 | 24.16 |
| Daily Pivot Point R1 | 24.82 |
| Daily Pivot Point R2 | 25.03 |
| Daily Pivot Point R3 | 25.15 |
[/s2If]
Download Nehcap EAWe have two EAs that are operational on our LIVE accounts.
- EA-FIX: Check out the details here. Download EA-FIX . EA-FIX is a non-grid HFT scalper.
- EA-GROWTH: High quality low dd EA using trend grids. Download EA_GROWTHJoin Our Telegram Group
")


