The US dollar to Mexican peso exchange rate is currently at 16.8201. The Mexican peso is strengthening as Mexico’s mid-month July Consumer Price Index (CPI) surpasses expectations, rising by 4.79% compared to the same period last year.
…
This is a premium post.
[s2If !current_user_can(access_s2member_level4)]Please register for FREE REGISTER to read full post below containing analysis. In case of any error or you think you are not able to read the full post below, please email us at support#nehcap.com [lwa][/s2If] [s2If current_user_can(access_s2member_level1)]
- The Mexican Peso gains momentum after Mexico’s mid-month July CPI outperforms estimates, increasing by 4.79% YoY.
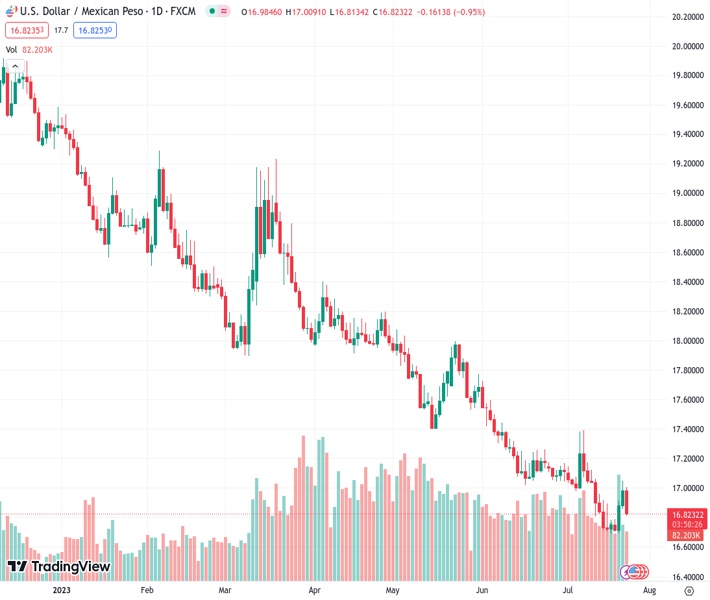
The pair currently trades last at 16.8201.
The previous day high was 17.0512 while the previous day low was 16.8611. The daily 38.2% Fib levels comes at 16.9786, expected to provide resistance. Similarly, the daily 61.8% fib level is at 16.9337, expected to provide resistance.
USD/MXN erased last Friday’s gains amid a data dump from the United States (US) and Mexico, bolstering the emerging market currency as the Mexican Peso (MXN) advances on an inflation report. At the time of writing, the USD/MXN is trading at 16.8277 after reaching a daily high of 17.0091.
As previously mentioned, the Instituto National de Estadistica, Geografia e Informatica, known as INEGI, revealed that Mexico’s mid-month July Consumer Price Index (CPI) rose by 4.79% YoY, above estimates of 4.7%, but below the prior’s 5.18% reading. Regarding core CPI, data came at 6.76% YoY, above forecasts of 6.73% though it dipped from 6.91%.
Given the fact that the Bank of Mexico, also known as Banxico, decided to keep rates on hold twice after peaking at 11.25%, the data could trigger a shift if core inflation stickiness continues to be an issue keeping inflation from reaching Banxico’s plus/minus 3% target. A source cited by Reuters commented, “The increase in the services component was ‘mainly due to higher airfares and tourist package.’”
In the US, S&P Global revealed that manufacturing activity improved from 46.3 in June to 49 in July, exceeding estimates. That cushioned the fall in services, with its PMI sliding to 52.4 from 54.4 last month. Consequently, the Composite PMI index dropped to 52 in July from 53.2 in June and slowed to a five-month low, reflecting the impact of 500 bps of tightening by the US Federal Reserve (Fed).
On Tuesday, the Fed would begin its two-day monetary policy meeting. Market participants expect the US central bank to deliver a 25 bps rate hike, but as most economists foresee, that would be the last increase; hawkish remarks by the Fed Chair could lift the USD/MXN toward the 17.00 mark and beyond. Otherwise, a dovish stance, and interest rates differentials, favor the MXN as the carry trade prolongs the emerging market currency gains. Hence, further USD/MXN downside is expected.
The USD/MXN daily chart favors further downside, as today’s price action, coupled with last Friday, is forming a bearish-engulfing pattern, warranting further downside. Unless the Fed’s decision on Wednesday surprises the markets with a hawkish hike, the USD/MXN could challenge the October 2015 daily low of 16.3267, followed by the 16.00 mark. But firstly, USD/MXN must dive below 16.5000. Conversely, the USD/MXN could threaten the 20-day Exponential Moving Average (EMA) at 16.9567, followed by the 17.0000 figure. A breach of the latter will expose the 50-day EMA at 17.2269.
Technical Levels: Supports and Resistances
USDMXN currently trading at 16.834 at the time of writing. Pair opened at 16.9854 and is trading with a change of -0.89 % .
| Overview | Overview.1 | |
|---|---|---|
| 0 | Today last price | 16.8340 |
| 1 | Today Daily Change | -0.1514 |
| 2 | Today Daily Change % | -0.8900 |
| 3 | Today daily open | 16.9854 |
The pair remains strongly bearish on the daily time frame. It trades below the 20 SMA @ 16.9862, 50 SMA 17.2687, 100 SMA @ 17.7181 and 200 SMA @ 18.4664.
| Trends | Trends.1 | |
|---|---|---|
| 0 | Daily SMA20 | 16.9862 |
| 1 | Daily SMA50 | 17.2687 |
| 2 | Daily SMA100 | 17.7181 |
| 3 | Daily SMA200 | 18.4664 |
The previous day high was 17.0512 while the previous day low was 16.8611. The daily 38.2% Fib levels comes at 16.9786, expected to provide resistance. Similarly, the daily 61.8% fib level is at 16.9337, expected to provide resistance.
Note the levels of interest below:
- Pivot support is noted at 16.8806, 16.7758, 16.6905
- Pivot resistance is noted at 17.0707, 17.156, 17.2608
| Levels | Levels.1 |
|---|---|
| Previous Daily High | 17.0512 |
| Previous Daily Low | 16.8611 |
| Previous Weekly High | 17.0512 |
| Previous Weekly Low | 16.6924 |
| Previous Monthly High | 17.7286 |
| Previous Monthly Low | 17.0243 |
| Daily Fibonacci 38.2% | 16.9786 |
| Daily Fibonacci 61.8% | 16.9337 |
| Daily Pivot Point S1 | 16.8806 |
| Daily Pivot Point S2 | 16.7758 |
| Daily Pivot Point S3 | 16.6905 |
| Daily Pivot Point R1 | 17.0707 |
| Daily Pivot Point R2 | 17.1560 |
| Daily Pivot Point R3 | 17.2608 |
[/s2If]
Download Nehcap EAWe have two EAs that are operational on our LIVE accounts.
- EA-FIX: Check out the details here. Download EA-FIX . EA-FIX is a non-grid HFT scalper.
- EA-GROWTH: High quality low dd EA using trend grids. Download EA_GROWTHJoin Our Telegram Group
")


