The price of silver, represented by #XAGUSD, has stopped decreasing for two days and rebounded from a low point reached in the past week. According to @nehcap’s opinion, there is anticipation of a continued improvement in its value.
…
This is a premium post.
[s2If !current_user_can(access_s2member_level4)]Please register for FREE REGISTER to read full post below containing analysis. In case of any error or you think you are not able to read the full post below, please email us at support#nehcap.com [lwa][/s2If] [s2If current_user_can(access_s2member_level1)]
- Silver Price snaps two-day losing streak while bouncing off one-week low.
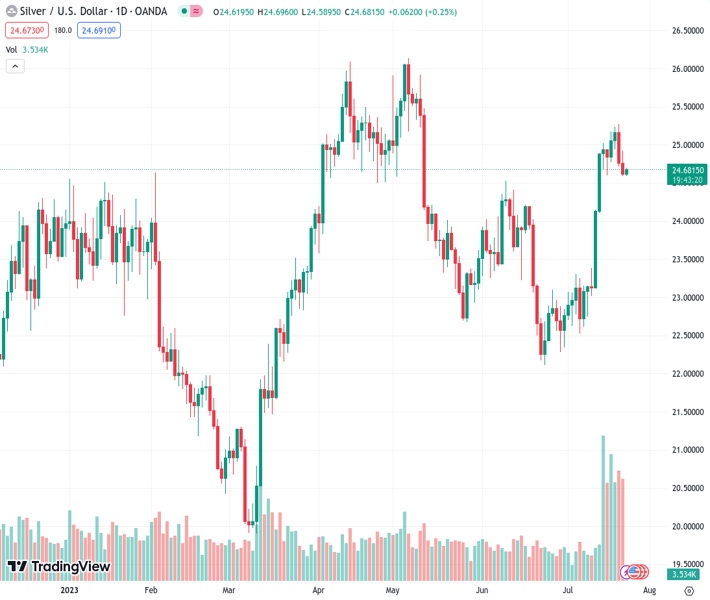
The pair currently trades last at 24.683.
The previous day high was 24.92 while the previous day low was 24.59. The daily 38.2% Fib levels comes at 24.72, expected to provide resistance. Similarly, the daily 61.8% fib level is at 24.79, expected to provide resistance.
Silver Price (XAG/USD) remains mildly bid around $24.65 amid early Monday morning in Asia. In doing so, the XAG/USD recovers from the 10-DMA and three-month-old horizontal support amid upbeat oscillators.
That said, bullish MACD signals and the upbeat RSI (14) add strength to the upside bias about the XAG/USD price.
It’s worth noting that the $25.00 round figure guards the immediate upside of the Silver Price ahead of the latest swing high of around $25.30.
Following that, the yearly high marked in May around $26.15 will lure the XAG/USD buyers.
Meanwhile, a daily closing below the 10-DMA and a horizontal support area comprising multiple levels marked since late April, respectively near the $24.60 and $24.60-50 region, will convince short-term silver sellers.
Even so, a convergence of the 100-DMA and 38.2% Fibonacci retracement level of its March-May upside, near $23.75 at the latest, appears a tough nut to crack for the Silver buyers.
Following that, an ascending support line stretched from late June, around $23.15 by the press time, can’t be ruled out.
Overall, the Silver Price (XAG/USD) is likely to remain firmer unless breaking $23.15.
Trend: Further recovery expected
Technical Levels: Supports and Resistances
XAGUSD currently trading at 24.67 at the time of writing. Pair opened at 24.6 and is trading with a change of 0.28% % .
| Overview | Overview.1 | |
|---|---|---|
| 0 | Today last price | 24.67 |
| 1 | Today Daily Change | 0.07 |
| 2 | Today Daily Change % | 0.28% |
| 3 | Today daily open | 24.6 |
The pair remains strongly bullish on the daily timeframe. It trades above its 20 SMA @ 23.66, 50 SMA 23.58, 100 SMA @ 23.73 and 200 SMA @ 22.91.
| Trends | Trends.1 | |
|---|---|---|
| 0 | Daily SMA20 | 23.66 |
| 1 | Daily SMA50 | 23.58 |
| 2 | Daily SMA100 | 23.73 |
| 3 | Daily SMA200 | 22.91 |
The previous day high was 24.92 while the previous day low was 24.59. The daily 38.2% Fib levels comes at 24.72, expected to provide resistance. Similarly, the daily 61.8% fib level is at 24.79, expected to provide resistance.
Note the levels of interest below:
- Pivot support is noted at 24.49, 24.38, 24.16
- Pivot resistance is noted at 24.82, 25.03, 25.15
| Levels | Levels.1 |
|---|---|
| Previous Daily High | 24.92 |
| Previous Daily Low | 24.59 |
| Previous Weekly High | 25.27 |
| Previous Weekly Low | 24.59 |
| Previous Monthly High | 24.53 |
| Previous Monthly Low | 22.11 |
| Daily Fibonacci 38.2% | 24.72 |
| Daily Fibonacci 61.8% | 24.79 |
| Daily Pivot Point S1 | 24.49 |
| Daily Pivot Point S2 | 24.38 |
| Daily Pivot Point S3 | 24.16 |
| Daily Pivot Point R1 | 24.82 |
| Daily Pivot Point R2 | 25.03 |
| Daily Pivot Point R3 | 25.15 |
[/s2If]
Download Nehcap EAWe have two EAs that are operational on our LIVE accounts.
- EA-FIX: Check out the details here. Download EA-FIX . EA-FIX is a non-grid HFT scalper.
- EA-GROWTH: High quality low dd EA using trend grids. Download EA_GROWTHJoin Our Telegram Group
")


