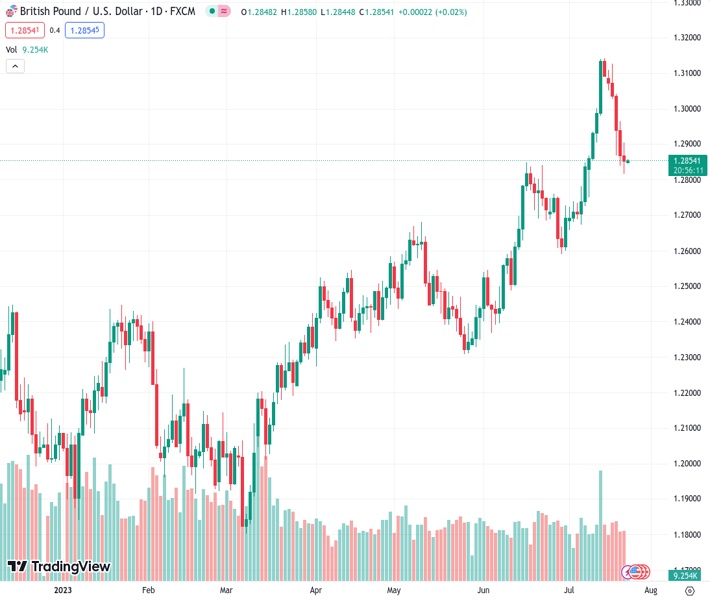
The GBPUSD pair at a rate of 1.28531 is uncertain about its direction following its significant decline in value during the past week. The perspective provided by @nehcap suggests that any further decline is expected to be minimal.
…
This is a premium post.
[s2If !current_user_can(access_s2member_level4)]Please register for FREE REGISTER to read full post below containing analysis. In case of any error or you think you are not able to read the full post below, please email us at support#nehcap.com [lwa][/s2If] [s2If current_user_can(access_s2member_level1)]
- GBP/USD remains indecisive after positing the biggest weekly loss in six months.
The pair currently trades last at 1.28531.
The previous day high was 1.2905 while the previous day low was 1.2816. The daily 38.2% Fib levels comes at 1.285, expected to provide support. Similarly, the daily 61.8% fib level is at 1.2871, expected to provide resistance.
GBP/USD remains sidelined while licking its wounds around 1.2850 after the heavy weekly fall during early Monday morning in Asia. In doing so, the Cable pair seesaws between the 100 and 200 Exponential Moving Average (EMA) as the oscillators appear poking bears ahead of the key preliminary readings of the UK and US PMIs for July.
Also read: GBP/USD Weekly Forecast: Down but not out, awaiting the Fed
With this, GBP/USD remains sidelined unless trading between the aforementioned EMA envelope, currently between 1.2890 and 1.2790.
That said, the impending bull cross on the MACD and the nearly oversold RSI (14) line suggests a corrective bounce off the Pound Sterling, which in turn highlights the 100-EMA hurdle of 1.2890.
Following that, the horizontal area comprising multiple levels marked since July 12, near 1.2965-80, will be crucial to watch as a clear break of the same will propel the quote towards the multi-month high marked earlier in July around 1.3145.
However, the 1.3000 psychological magnet and July 17 swing low of around 1.3065 can act as an intermediate halt during the anticipated run-up.
Meanwhile, a downside break of the 200-EMA support of around 1.2790 isn’t a clear call for the GBP/USD sellers as an upward-sloping support line from late May, near 1.2770 at the latest, could challenge the bears.
In a case where the Cable pair remains bearish past 1.2770, the odds of witnessing a gradual decline towards the late June swing low surrounding 1.2590 can’t be ruled out.
Trend: Limited downside expected
Technical Levels: Supports and Resistances
GBPUSD currently trading at 1.285 at the time of writing. Pair opened at 1.2853 and is trading with a change of -0.02% % .
| Overview | Overview.1 | |
|---|---|---|
| 0 | Today last price | 1.285 |
| 1 | Today Daily Change | -0.0003 |
| 2 | Today Daily Change % | -0.02% |
| 3 | Today daily open | 1.2853 |
The pair remains strongly bullish on the daily timeframe. It trades above its 20 SMA @ 1.2844, 50 SMA 1.2659, 100 SMA @ 1.2508 and 200 SMA @ 1.2246.
| Trends | Trends.1 | |
|---|---|---|
| 0 | Daily SMA20 | 1.2844 |
| 1 | Daily SMA50 | 1.2659 |
| 2 | Daily SMA100 | 1.2508 |
| 3 | Daily SMA200 | 1.2246 |
The previous day high was 1.2905 while the previous day low was 1.2816. The daily 38.2% Fib levels comes at 1.285, expected to provide support. Similarly, the daily 61.8% fib level is at 1.2871, expected to provide resistance.
Note the levels of interest below:
- Pivot support is noted at 1.2811, 1.2769, 1.2723
- Pivot resistance is noted at 1.29, 1.2946, 1.2988
| Levels | Levels.1 |
|---|---|
| Previous Daily High | 1.2905 |
| Previous Daily Low | 1.2816 |
| Previous Weekly High | 1.3126 |
| Previous Weekly Low | 1.2816 |
| Previous Monthly High | 1.2848 |
| Previous Monthly Low | 1.2369 |
| Daily Fibonacci 38.2% | 1.2850 |
| Daily Fibonacci 61.8% | 1.2871 |
| Daily Pivot Point S1 | 1.2811 |
| Daily Pivot Point S2 | 1.2769 |
| Daily Pivot Point S3 | 1.2723 |
| Daily Pivot Point R1 | 1.2900 |
| Daily Pivot Point R2 | 1.2946 |
| Daily Pivot Point R3 | 1.2988 |
[/s2If]
Download Nehcap EAWe have two EAs that are operational on our LIVE accounts.
- EA-FIX: Check out the details here. Download EA-FIX . EA-FIX is a non-grid HFT scalper.
- EA-GROWTH: High quality low dd EA using trend grids. Download EA_GROWTHJoin Our Telegram Group
")


