The GBPUSD currency pair has experienced a seven-day decline due to a decrease in US business activity and a pessimistic outlook on the UK economy.
…
This is a premium post.
[s2If !current_user_can(access_s2member_level4)]Please register for FREE REGISTER to read full post below containing analysis. In case of any error or you think you are not able to read the full post below, please email us at support#nehcap.com [lwa][/s2If] [s2If current_user_can(access_s2member_level1)]
- US business activity slowdown and gloomy UK economic outlook push GBP/USD into a seven-day slump.
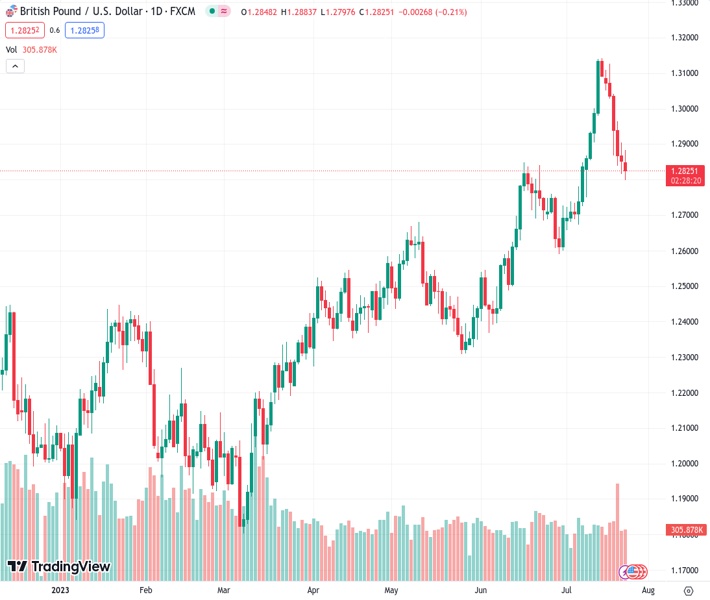
The pair currently trades last at 1.28260.
The previous day high was 1.2905 while the previous day low was 1.2816. The daily 38.2% Fib levels comes at 1.285, expected to provide resistance. Similarly, the daily 61.8% fib level is at 1.2871, expected to provide resistance.
GBP/USD extends its downtrend to seven consecutive days amidst mixed economic data from the United States (US), while further deterioration in the United Kingdom (UK) economy paints a gloomy scenario as the Bank of England (BoE) struggles to curb high inflation. At the time of writing, the GBP/USD is trading at 1.2831 after reaching a high of 1.2883, down 0.16%.
Business activity in the US slowed down, as revealed by S&P Global mixed readings. As shown by the Manufacturing PMI, activity came at 49, above June’s 46.3 as well as estimates, but remained in recessionary territory. Services PMI clung to expansionary territory at 52.4, trailed estimates, and the previous month at 54.4, dragging the composite number to 52 in July, from 53.2 in June, falling to a five-month low.
That weighed on the GBP/USD pair, which began dipping during the European session, with UK PMI showing a preliminary drop to 50.7 from 52.8 in June, the biggest MoM fall in 11 months, as reported by Reuters.
“Rising interest rates and the higher cost of living appear to be taking an increased toll on households, dampening a post-pandemic rebound in spending on leisure activities,” said Chris Williamson, chief business economist at S&P Global, which produces the data.
Late in the week, the Fed would deliver its interest rates decision, with markets estimating a 25 bps increase in the Federal Funds Rates (FFR) to 5.25-5.50%. However, Fed Chair Jerome Powell’s press conference is eyed because the swaps market does not show another Fed hike. Hawkish remarks by Powell could rock the boat, with the GBP/USD extending its losses toward the 1.2700 area, while dovish remarks could lift the pair toward 1.2900 or beyond.
The GBP/USD prolongs its downtrend, past below the 61.8% Fibonacci (Fibo) retracement at 1.2851, which could open the door for further losses past the 1.2800 mark. Of note, the GBP/USD slid below the 20-day Exponential Moving Average (EMA) at 1.2862, exacerbating a drop below the 1.2800 figure, but prices recovered from that level toward 1.2830. Nevertheless, If GBP/USD breaks the 1.2800 floors, the next support would emerge at the 78.6% Fibo level at 1.2773 before extending to ward the 50-day EMA at 1.2717. Conversely, if GBP/USD stays afloat at 1.2800, that could open the door to reclaiming the 20-day EMA, followed by 1.2900.
Technical Levels: Supports and Resistances
GBPUSD currently trading at 1.2826 at the time of writing. Pair opened at 1.2853 and is trading with a change of -0.21 % .
| Overview | Overview.1 | |
|---|---|---|
| 0 | Today last price | 1.2826 |
| 1 | Today Daily Change | -0.0027 |
| 2 | Today Daily Change % | -0.2100 |
| 3 | Today daily open | 1.2853 |
The pair is trading below its 20 Daily moving average @ 1.2844, above its 50 Daily moving average @ 1.2659 , above its 100 Daily moving average @ 1.2508 and above its 200 Daily moving average @ 1.2246
| Trends | Trends.1 | |
|---|---|---|
| 0 | Daily SMA20 | 1.2844 |
| 1 | Daily SMA50 | 1.2659 |
| 2 | Daily SMA100 | 1.2508 |
| 3 | Daily SMA200 | 1.2246 |
The previous day high was 1.2905 while the previous day low was 1.2816. The daily 38.2% Fib levels comes at 1.285, expected to provide resistance. Similarly, the daily 61.8% fib level is at 1.2871, expected to provide resistance.
Note the levels of interest below:
- Pivot support is noted at 1.2811, 1.2769, 1.2723
- Pivot resistance is noted at 1.29, 1.2946, 1.2988
| Levels | Levels.1 |
|---|---|
| Previous Daily High | 1.2905 |
| Previous Daily Low | 1.2816 |
| Previous Weekly High | 1.3126 |
| Previous Weekly Low | 1.2816 |
| Previous Monthly High | 1.2848 |
| Previous Monthly Low | 1.2369 |
| Daily Fibonacci 38.2% | 1.2850 |
| Daily Fibonacci 61.8% | 1.2871 |
| Daily Pivot Point S1 | 1.2811 |
| Daily Pivot Point S2 | 1.2769 |
| Daily Pivot Point S3 | 1.2723 |
| Daily Pivot Point R1 | 1.2900 |
| Daily Pivot Point R2 | 1.2946 |
| Daily Pivot Point R3 | 1.2988 |
[/s2If]
Download Nehcap EAWe have two EAs that are operational on our LIVE accounts.
- EA-FIX: Check out the details here. Download EA-FIX . EA-FIX is a non-grid HFT scalper.
- EA-GROWTH: High quality low dd EA using trend grids. Download EA_GROWTHJoin Our Telegram Group
")


