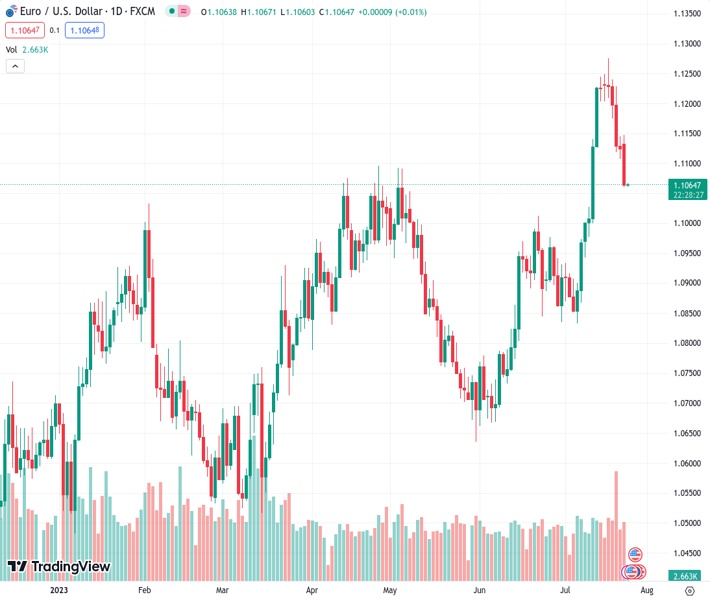
The EURUSD pair, currently at 1.10652, continues to stay inactive at its lowest point in a fortnight following a downward movement over the past five days.
…
This is a premium post.
[s2If !current_user_can(access_s2member_level4)]Please register for FREE REGISTER to read full post below containing analysis. In case of any error or you think you are not able to read the full post below, please email us at support#nehcap.com [lwa][/s2If] [s2If current_user_can(access_s2member_level1)]
- EUR/USD remains sidelined at the lowest level in two weeks after five-day downtrend.
The pair currently trades last at 1.10652.
The previous day high was 1.1145 while the previous day low was 1.1108. The daily 38.2% Fib levels comes at 1.1122, expected to provide resistance. Similarly, the daily 61.8% fib level is at 1.1131, expected to provide resistance.
EUR/USD holds lower grounds near 1.1065 after falling in the last five consecutive days to a fresh two-week low, mostly sidelined amid the early hours of Tuesday’s Asian session. That said, the Euro pair dropped the previous day as the monthly PMIs from the Eurozone and Germany bolstered the market’s fears of the economic slowdown in the old continent and tested hawkish bias about the European Central Bank (ECB). Also, comparatively better US data joined upbeat US Treasury bond yields to allow the US Dollar to rise further and exerted additional downside pressure on the major currency pair.
On Monday, the preliminary readings of the Eurozone HCOB Manufacturing PMI slumped to the lowest level since May 2020, to 42.7 for July from 43.4 prior and versus 43.5 market forecasts. That said, the Services PMI also eased to 51.1 for the said month from 52.0 prior and 52.5 expected while the Composite PMI slid to 48.9 from 49.9 previous readings and analysts’ estimations of 49.7. On the same line, German HCOB Manufacturing PMI also dropped to the 38-month low while Services and Composite PMIs declined below the market expectations and previous readings for July.
Talking about the first readings of the US S&P Global PMI for July, the headline Manufacturing PMI improved to 49.0 from 46.3 prior and 46.4 market forecasts while the Services PMI eased to 52.4 versus 54.0 expected and 54.4 previous readings. With this, the Composite PMI edged lower to 52.0 from 53.2 prior and 53.1 market forecasts. However, Chicago Fed National Activity Index for June slid to -0.32 from -0.28 prior (revised) and 0.03 market forecasts.
Considering the data, the US Dollar Index (DXY) rose for the fifth consecutive day to refresh the highest levels in nearly a fortnight while the Euro dropped across the board. With this in mind, Analysts at the ANZ said, “We are of the view that the expected 25bp rate rises from the FOMC and ECB this week will mark the end of the current tightening cycle although central banks are likely to maintain their hawkish guidance given still elevated inflation.”
Moving on, the ECB Bank Lending Survey and Germany’s IFO poll details will entertain EUR/USD traders ahead of the US CB Consumer Confidence. However, major attention will be given to Wednesday’s Fed monetary policy meeting and Thursday’s ECB announcements for clear directions.
Also read: Federal Reserve Preview: Powell can play three distinct cards, each with a different US Dollar move
A daily closing beneath the previous resistance line from February, now an immediate hurdle around 1.1150, directs EUR/USD towards the previous monthly low of 1.1012.
Technical Levels: Supports and Resistances
EURUSD currently trading at 1.1065 at the time of writing. Pair opened at 1.1127 and is trading with a change of -0.56% % .
| Overview | Overview.1 | |
|---|---|---|
| 0 | Today last price | 1.1065 |
| 1 | Today Daily Change | -0.0062 |
| 2 | Today Daily Change % | -0.56% |
| 3 | Today daily open | 1.1127 |
The pair remains strongly bullish on the daily timeframe. It trades above its 20 SMA @ 1.1029, 50 SMA 1.0894, 100 SMA @ 1.0882 and 200 SMA @ 1.0689.
| Trends | Trends.1 | |
|---|---|---|
| 0 | Daily SMA20 | 1.1029 |
| 1 | Daily SMA50 | 1.0894 |
| 2 | Daily SMA100 | 1.0882 |
| 3 | Daily SMA200 | 1.0689 |
The previous day high was 1.1145 while the previous day low was 1.1108. The daily 38.2% Fib levels comes at 1.1122, expected to provide resistance. Similarly, the daily 61.8% fib level is at 1.1131, expected to provide resistance.
Note the levels of interest below:
- Pivot support is noted at 1.1108, 1.1089, 1.1071
- Pivot resistance is noted at 1.1145, 1.1164, 1.1182
| Levels | Levels.1 |
|---|---|
| Previous Daily High | 1.1145 |
| Previous Daily Low | 1.1108 |
| Previous Weekly High | 1.1276 |
| Previous Weekly Low | 1.1108 |
| Previous Monthly High | 1.1012 |
| Previous Monthly Low | 1.0662 |
| Daily Fibonacci 38.2% | 1.1122 |
| Daily Fibonacci 61.8% | 1.1131 |
| Daily Pivot Point S1 | 1.1108 |
| Daily Pivot Point S2 | 1.1089 |
| Daily Pivot Point S3 | 1.1071 |
| Daily Pivot Point R1 | 1.1145 |
| Daily Pivot Point R2 | 1.1164 |
| Daily Pivot Point R3 | 1.1182 |
[/s2If]
Download Nehcap EAWe have two EAs that are operational on our LIVE accounts.
- EA-FIX: Check out the details here. Download EA-FIX . EA-FIX is a non-grid HFT scalper.
- EA-GROWTH: High quality low dd EA using trend grids. Download EA_GROWTHJoin Our Telegram Group
")


