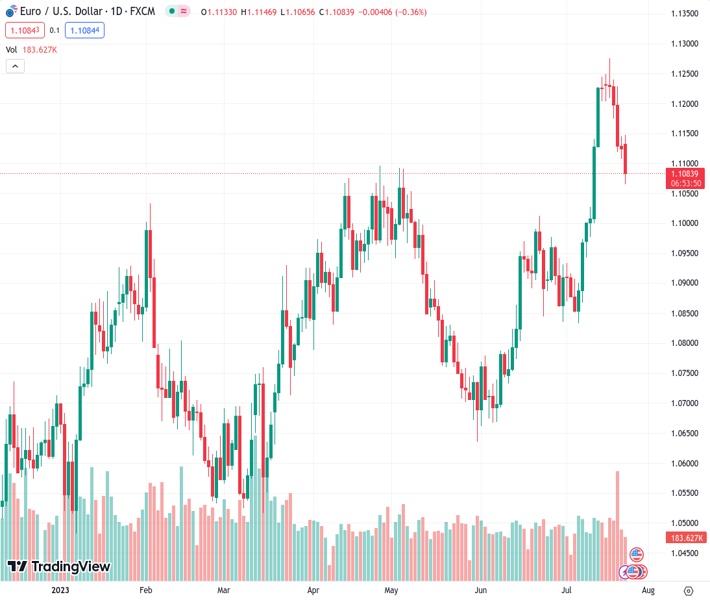
The EURUSD currency pair, trading at 1.10871, continues its decline for several days, reaching a level of around 1.1065/60.
…
This is a premium post.
[s2If !current_user_can(access_s2member_level4)]Please register for FREE REGISTER to read full post below containing analysis. In case of any error or you think you are not able to read the full post below, please email us at support#nehcap.com [lwa][/s2If] [s2If current_user_can(access_s2member_level1)]
- EUR/USD extends the multi-day pullback to the 1.1065/60 zone.
The pair currently trades last at 1.10871.
The previous day high was 1.1145 while the previous day low was 1.1108. The daily 38.2% Fib levels comes at 1.1122, expected to provide resistance. Similarly, the daily 61.8% fib level is at 1.1131, expected to provide resistance.
EUR/USD keeps the bearish note unchanged and breaks below the key 1.1100 support to print new 2-week lows on Monday.
Further losses seem in store for the pair in the near term. That said, the continuation of the downward bias could drag the pair to the psychological 1.1000 region in the not-so-distant future.
Looking at the longer run, the positive view remains unchanged while above the 200-day SMA, today at 1.0693.
Technical Levels: Supports and Resistances
EURUSD currently trading at 1.1094 at the time of writing. Pair opened at 1.1127 and is trading with a change of -0.3 % .
| Overview | Overview.1 | |
|---|---|---|
| 0 | Today last price | 1.1094 |
| 1 | Today Daily Change | 81.0000 |
| 2 | Today Daily Change % | -0.3000 |
| 3 | Today daily open | 1.1127 |
The pair remains strongly bullish on the daily timeframe. It trades above its 20 SMA @ 1.1029, 50 SMA 1.0894, 100 SMA @ 1.0882 and 200 SMA @ 1.0689.
| Trends | Trends.1 | |
|---|---|---|
| 0 | Daily SMA20 | 1.1029 |
| 1 | Daily SMA50 | 1.0894 |
| 2 | Daily SMA100 | 1.0882 |
| 3 | Daily SMA200 | 1.0689 |
The previous day high was 1.1145 while the previous day low was 1.1108. The daily 38.2% Fib levels comes at 1.1122, expected to provide resistance. Similarly, the daily 61.8% fib level is at 1.1131, expected to provide resistance.
Note the levels of interest below:
- Pivot support is noted at 1.1108, 1.1089, 1.1071
- Pivot resistance is noted at 1.1145, 1.1164, 1.1182
| Levels | Levels.1 |
|---|---|
| Previous Daily High | 1.1145 |
| Previous Daily Low | 1.1108 |
| Previous Weekly High | 1.1276 |
| Previous Weekly Low | 1.1108 |
| Previous Monthly High | 1.1012 |
| Previous Monthly Low | 1.0662 |
| Daily Fibonacci 38.2% | 1.1122 |
| Daily Fibonacci 61.8% | 1.1131 |
| Daily Pivot Point S1 | 1.1108 |
| Daily Pivot Point S2 | 1.1089 |
| Daily Pivot Point S3 | 1.1071 |
| Daily Pivot Point R1 | 1.1145 |
| Daily Pivot Point R2 | 1.1164 |
| Daily Pivot Point R3 | 1.1182 |
[/s2If]
Download Nehcap EAWe have two EAs that are operational on our LIVE accounts.
- EA-FIX: Check out the details here. Download EA-FIX . EA-FIX is a non-grid HFT scalper.
- EA-GROWTH: High quality low dd EA using trend grids. Download EA_GROWTHJoin Our Telegram Group
")


