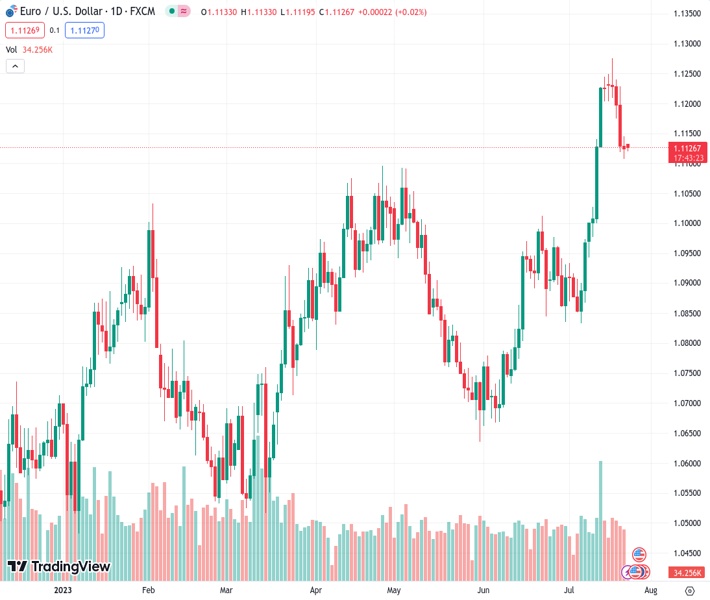
The EURUSD currency pair, currently trading at 1.11275, remains cautious at its lowest point in the last eight days following a recent end to its upward trend of three weeks. According to @nehcap’s perspective, only a minor rebound is anticipated.
…
This is a premium post.
[s2If !current_user_can(access_s2member_level4)]Please register for FREE REGISTER to read full post below containing analysis. In case of any error or you think you are not able to read the full post below, please email us at support#nehcap.com [lwa][/s2If] [s2If current_user_can(access_s2member_level1)]
- EUR/USD stays defensive at the lowest levels in eight days after snapping three-week uptrend.
The pair currently trades last at 1.11275.
The previous day high was 1.1145 while the previous day low was 1.1108. The daily 38.2% Fib levels comes at 1.1122, expected to provide support. Similarly, the daily 61.8% fib level is at 1.1131, expected to provide resistance.
EUR/USD edges higher past 1.1100 after bouncing off the lowest level in a week, indecisive around 1.1130 amid early Monday morning in Europe. In doing so, the Euro pair lacks clear directions while defending the previous day’s rebound from a three-month-old horizontal support zone, currently around 1.1100-1090.
The corrective pullback also portrays the market’s positioning for today’s preliminary readings of the US and Eurozone PMIs for July, as well as the cautious mood ahead of the monetary policy decision of the European central bank (ECB) and the Federal Reserve (Fed).
Also read: EUR/USD steadies above 1.1100 after three-day losing streak, EU/US PMI data, ECB, Fed eyed
Apart from the aforementioned support zone, the receding bearish bias of the MACD signals also challenges the EUR/USD sellers, which in turn suggests the extension of the latest corrective bounce.
However, a downward-sloping resistance line from the latest multi-month peak marked on July 18, around 1.1180 at the latest, restricts the immediate upside of the EUR/USD pair. Following that, the 50-SMA can act as the final defense of the sellers around 1.1190. It’s worth observing that the 1.1200 round figure may also check the pair buyers before directing them to the latest peak surrounding 1.1275.
On the flip side, a clear break of the 1.1090 support could quickly drag the EUR/USD price toward another horizontal support area comprising levels marked since late June, around 1.1010-1000 at the latest.
In a case where the EUR/USD remains bearish past 1.1000, an ascending support line from May 31, close to 1.0920, will be the key support before pleasing the pair sellers.
Trend: Limited recovery expected
Technical Levels: Supports and Resistances
EURUSD currently trading at 1.1126 at the time of writing. Pair opened at 1.1127 and is trading with a change of -0.01% % .
| Overview | Overview.1 | |
|---|---|---|
| 0 | Today last price | 1.1126 |
| 1 | Today Daily Change | -0.0001 |
| 2 | Today Daily Change % | -0.01% |
| 3 | Today daily open | 1.1127 |
The pair remains strongly bullish on the daily timeframe. It trades above its 20 SMA @ 1.1029, 50 SMA 1.0894, 100 SMA @ 1.0882 and 200 SMA @ 1.0689.
| Trends | Trends.1 | |
|---|---|---|
| 0 | Daily SMA20 | 1.1029 |
| 1 | Daily SMA50 | 1.0894 |
| 2 | Daily SMA100 | 1.0882 |
| 3 | Daily SMA200 | 1.0689 |
The previous day high was 1.1145 while the previous day low was 1.1108. The daily 38.2% Fib levels comes at 1.1122, expected to provide support. Similarly, the daily 61.8% fib level is at 1.1131, expected to provide resistance.
Note the levels of interest below:
- Pivot support is noted at 1.1108, 1.1089, 1.1071
- Pivot resistance is noted at 1.1145, 1.1164, 1.1182
| Levels | Levels.1 |
|---|---|
| Previous Daily High | 1.1145 |
| Previous Daily Low | 1.1108 |
| Previous Weekly High | 1.1276 |
| Previous Weekly Low | 1.1108 |
| Previous Monthly High | 1.1012 |
| Previous Monthly Low | 1.0662 |
| Daily Fibonacci 38.2% | 1.1122 |
| Daily Fibonacci 61.8% | 1.1131 |
| Daily Pivot Point S1 | 1.1108 |
| Daily Pivot Point S2 | 1.1089 |
| Daily Pivot Point S3 | 1.1071 |
| Daily Pivot Point R1 | 1.1145 |
| Daily Pivot Point R2 | 1.1164 |
| Daily Pivot Point R3 | 1.1182 |
[/s2If]
Download Nehcap EAWe have two EAs that are operational on our LIVE accounts.
- EA-FIX: Check out the details here. Download EA-FIX . EA-FIX is a non-grid HFT scalper.
- EA-GROWTH: High quality low dd EA using trend grids. Download EA_GROWTHJoin Our Telegram Group
")


