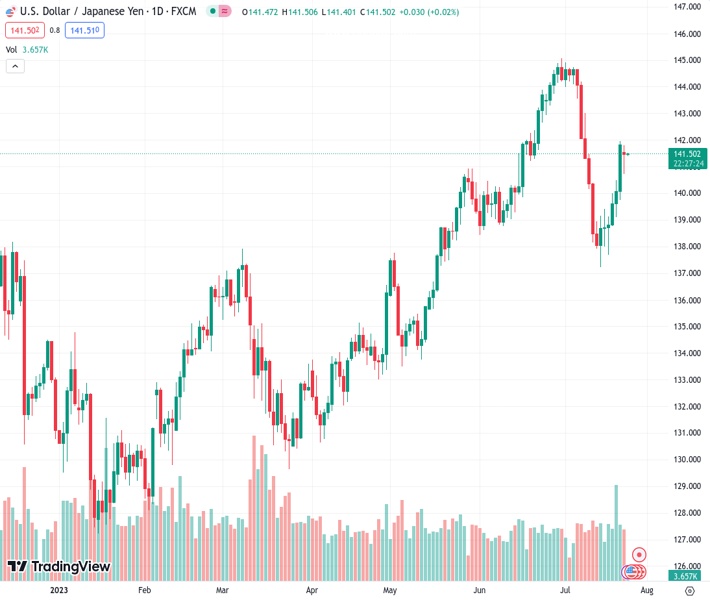
The currency pair USDJPY, which was trading at 141.491, recently made an effort to adopt a bearish stance. In the past few days, three different technical indicators have pointed towards a possible downward trend.
…
This is a premium post.
[s2If !current_user_can(access_s2member_level4)]Please register for FREE REGISTER to read full post below containing analysis. In case of any error or you think you are not able to read the full post below, please email us at support#nehcap.com [lwa][/s2If] [s2If current_user_can(access_s2member_level1)]
- USD/JPY attempted to shift to a bearish outlook over the last couple of days, with three technical indicators suggesting a potential downside.
The pair currently trades last at 141.491.
The previous day high was 141.96 while the previous day low was 139.75. The daily 38.2% Fib levels comes at 141.11, expected to provide support. Similarly, the daily 61.8% fib level is at 140.59, expected to provide support.
USD/JPY trades flat as the Asian session begins, exchanging hands at around 141.40s, following a choppy trading session, which formed a dragonfly doji. Hence, during the last couple of days, price action has tried to shift the USD/JPY pair bearish, with three technical indicators paving the way for further downside. At the time of writing, the USD/JPY is trading at 141.42.
The daily chart portrays the pair trading above the Kijun-Sen at 141.43, which could pave the way for further upside, but buyers must reclaim the latest two-week high of 141.95. if USD/JPY breaks above 142.00, the next resistance will emerge at the top of the Ichimoku Cloud (Kumo) at around 142.80/95, ahead of challenging 143.00.
On the flip side, and the USD/JPY path of least resistance if prices stay below 142.00, the first support would be the Kijun-Sen at 141.15. A breach of that level will immediately expose the 141.00 psychological level, followed by a 5-month-old support trendline at around 140.50, before the majors test the next floor at the Tenkan-Sen line at 139.59.
Technical Levels: Supports and Resistances
USDJPY currently trading at 141.45 at the time of writing. Pair opened at 141.82 and is trading with a change of -0.26 % .
| Overview | Overview.1 | |
|---|---|---|
| 0 | Today last price | 141.45 |
| 1 | Today Daily Change | -0.37 |
| 2 | Today Daily Change % | -0.26 |
| 3 | Today daily open | 141.82 |
The pair is trading below its 20 Daily moving average @ 141.86, above its 50 Daily moving average @ 140.63 , above its 100 Daily moving average @ 137.2 and above its 200 Daily moving average @ 136.91
| Trends | Trends.1 | |
|---|---|---|
| 0 | Daily SMA20 | 141.86 |
| 1 | Daily SMA50 | 140.63 |
| 2 | Daily SMA100 | 137.20 |
| 3 | Daily SMA200 | 136.91 |
The previous day high was 141.96 while the previous day low was 139.75. The daily 38.2% Fib levels comes at 141.11, expected to provide support. Similarly, the daily 61.8% fib level is at 140.59, expected to provide support.
Note the levels of interest below:
- Pivot support is noted at 140.39, 138.97, 138.18
- Pivot resistance is noted at 142.6, 143.38, 144.81
| Levels | Levels.1 |
|---|---|
| Previous Daily High | 141.96 |
| Previous Daily Low | 139.75 |
| Previous Weekly High | 141.96 |
| Previous Weekly Low | 137.68 |
| Previous Monthly High | 145.07 |
| Previous Monthly Low | 138.43 |
| Daily Fibonacci 38.2% | 141.11 |
| Daily Fibonacci 61.8% | 140.59 |
| Daily Pivot Point S1 | 140.39 |
| Daily Pivot Point S2 | 138.97 |
| Daily Pivot Point S3 | 138.18 |
| Daily Pivot Point R1 | 142.60 |
| Daily Pivot Point R2 | 143.38 |
| Daily Pivot Point R3 | 144.81 |
[/s2If]
Download Nehcap EAWe have two EAs that are operational on our LIVE accounts.
- EA-FIX: Check out the details here. Download EA-FIX . EA-FIX is a non-grid HFT scalper.
- EA-GROWTH: High quality low dd EA using trend grids. Download EA_GROWTHJoin Our Telegram Group
")


