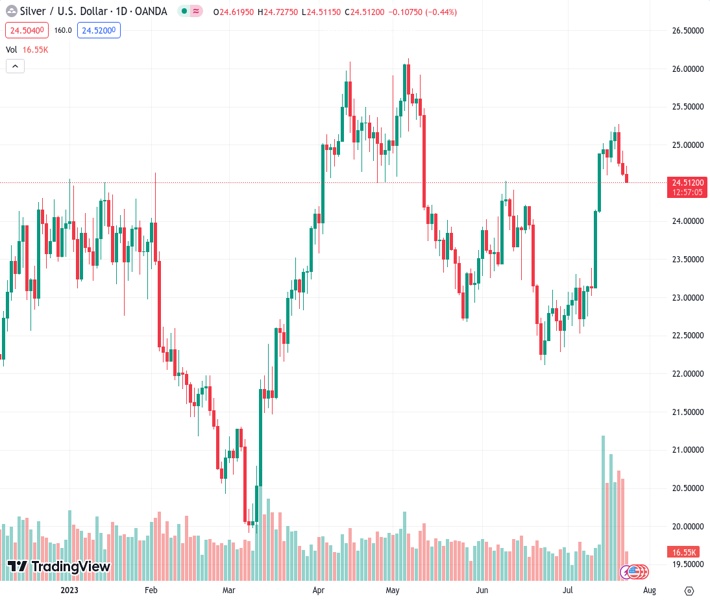
Silver seems to have found a level of support around the mid-$24.00 range, as it bounces back after a temporary decrease to its lowest point in over a week.
…
This is a premium post.
[s2If !current_user_can(access_s2member_level4)]Please register for FREE REGISTER to read full post below containing analysis. In case of any error or you think you are not able to read the full post below, please email us at support#nehcap.com [lwa][/s2If] [s2If current_user_can(access_s2member_level1)]
- Silver finds support near mid-$24.00s and reverses an intraday dip to over a one-week low.
The pair currently trades last at 24.525.
The previous day high was 24.92 while the previous day low was 24.59. The daily 38.2% Fib levels comes at 24.72, expected to provide resistance. Similarly, the daily 61.8% fib level is at 24.79, expected to provide resistance.
Silver rebounds from over a one-week low touched this Monday and trades with a mild positive bias, around the $24.65 region during the early European session. The white metal, for now, seems to have stalled a two-day corrective decline from the $24.25 area, or its highest level since May 11 set last Thursday.
From a technical perspective, the XAG/USD manages to defend the $24.50 strong horizontal resistance breakpoint, now turned support. The said area should now act as a pivotal point, which if broken decisively might prompt some technical selling and drag Silver towards the $24.00 mark. The downward trajectory could get extended further towards the $23.65-$23.60 support en route to the $23.20-$23.15 region.
Some follow-through selling, leading to a subsequent fall below the $23.00 round figure, which nears the very important 200-day Simple Moving Average (SMA), could negate any positive outlook and shift the near-term bias in favour of bearish traders. The XAG/USD might then turn vulnerable to accelerate the fall below the $22.75-$22.70 area, towards challenging the multi-month low, around the $22.15-$22.10 area.
Meanwhile, oscillators on the daily chart are holding comfortably in the positive territory and favour bullish traders. That said, technical indicators on hourly charts are yet to confirm the bullish outlook and warrant caution before positioning for a further intraday appreciating move. Hence, any subsequent move up might attract some sellers near the $25.00 psychological mark and remain capped near last week’s swing high, around the $25.25 area.
Some follow-through buying, however, should allow the XAG/USD to surpass the $25.50-$25.55 intermediate hurdle and aim to reclaim the $26.00 round figure. This is closely followed by the YTD peak, around the $26.10-$26.15 area touched in May, which if cleared will set the stage for an extension of the recent upward trajectory witnessed over the past month or so.
Technical Levels: Supports and Resistances
XAGUSD currently trading at 24.64 at the time of writing. Pair opened at 24.6 and is trading with a change of 0.16 % .
| Overview | Overview.1 | |
|---|---|---|
| 0 | Today last price | 24.64 |
| 1 | Today Daily Change | 0.04 |
| 2 | Today Daily Change % | 0.16 |
| 3 | Today daily open | 24.60 |
The pair remains strongly bullish on the daily timeframe. It trades above its 20 SMA @ 23.66, 50 SMA 23.58, 100 SMA @ 23.73 and 200 SMA @ 22.91.
| Trends | Trends.1 | |
|---|---|---|
| 0 | Daily SMA20 | 23.66 |
| 1 | Daily SMA50 | 23.58 |
| 2 | Daily SMA100 | 23.73 |
| 3 | Daily SMA200 | 22.91 |
The previous day high was 24.92 while the previous day low was 24.59. The daily 38.2% Fib levels comes at 24.72, expected to provide resistance. Similarly, the daily 61.8% fib level is at 24.79, expected to provide resistance.
Note the levels of interest below:
- Pivot support is noted at 24.49, 24.38, 24.16
- Pivot resistance is noted at 24.82, 25.03, 25.15
| Levels | Levels.1 |
|---|---|
| Previous Daily High | 24.92 |
| Previous Daily Low | 24.59 |
| Previous Weekly High | 25.27 |
| Previous Weekly Low | 24.59 |
| Previous Monthly High | 24.53 |
| Previous Monthly Low | 22.11 |
| Daily Fibonacci 38.2% | 24.72 |
| Daily Fibonacci 61.8% | 24.79 |
| Daily Pivot Point S1 | 24.49 |
| Daily Pivot Point S2 | 24.38 |
| Daily Pivot Point S3 | 24.16 |
| Daily Pivot Point R1 | 24.82 |
| Daily Pivot Point R2 | 25.03 |
| Daily Pivot Point R3 | 25.15 |
[/s2If]
Download Nehcap EAWe have two EAs that are operational on our LIVE accounts.
- EA-FIX: Check out the details here. Download EA-FIX . EA-FIX is a non-grid HFT scalper.
- EA-GROWTH: High quality low dd EA using trend grids. Download EA_GROWTHJoin Our Telegram Group
")


