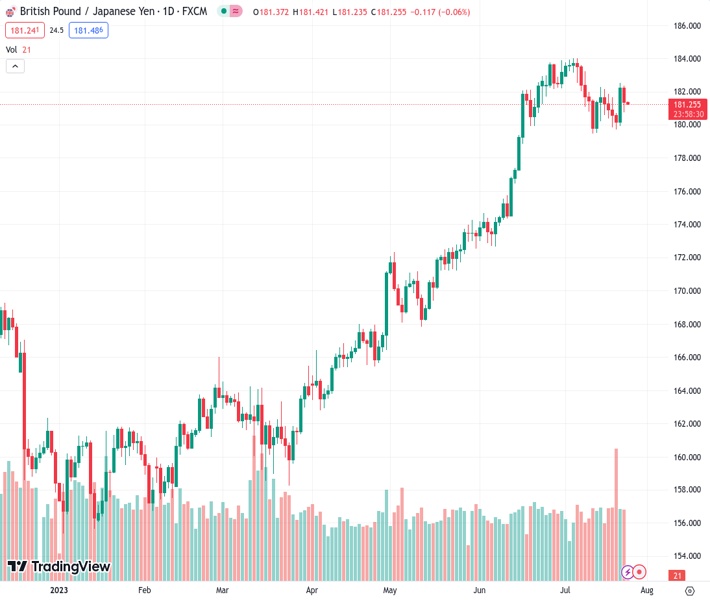
On Monday, the GBPJPY currency pair is trading at a value lower than 182.00, specifically at 181.438. The pair has experienced losses of over 0.40%.
…
This is a premium post.
[s2If !current_user_can(access_s2member_level4)]Please register for FREE REGISTER to read full post below containing analysis. In case of any error or you think you are not able to read the full post below, please email us at support#nehcap.com [lwa][/s2If] [s2If current_user_can(access_s2member_level1)]
- GBP/JPY trades below 182.00 on Monday, seeing more than 0.40% losses.
The pair currently trades last at 181.438.
The previous day high was 182.53 while the previous day low was 179.92. The daily 38.2% Fib levels comes at 181.53, expected to provide resistance. Similarly, the daily 61.8% fib level is at 180.92, expected to provide support.
Starting the week, the GBPJPY pair is trading lower near 181.35, though it has maintained relatively stable levels since mid-June. On the one hand, Japan reported solid PMIs in July, while the British ones came in weak sparkling dovish bets on the Bank of England, which decreased local yields, applying selling pressure on the GBP.
The British PMI monthly Composite Reports from July on Manufacturing and Services, released by S&P Global, all came lower than expected and sparked worries about the UK’s economic health. The manufacturing index slid to 45, while the Services and Global Composite fell to 52.4 and 51.5. As a reaction, the Bank of England’s (BoE) tightening expectations have fallen, with the odds of a 50 basis point (bps) decreasing to around 35% according to the World Interest Rate (WIRP) tool. Looking forward, 25 bps hikes are priced in for September and November, but the odds of a final hike in February 2024 slid to 35%.
Due to dovish bets on the BoE, British yields are falling. The 2-year yield fell nearly 1% to 4.88% while the 5 and 10-year rates to 4.31% and 4.22%, respectively, with similar declines of nearly 1%.
On the other hand, the Jibun Bank Services PMI released by Markit Economics remained steady at 52.1, while the Manufacturing Index fell slightly to 49.4. That said, markets are getting mixed signals ahead of Friday’s Bank of Japan (BoJ) decision. Governor Kazuo Ueda stated that a dovish interest rate policy should be maintained, while Japan’s top currency diplomat, Masato Kanda, stated that inflation surpassing expectations should make the bank consider a policy pivot. Still, the consensus is that the BoJ will steady its dovish stance.
The daily chart shows strong bearish momentum for the short term. The RSI (Relative Strength Index) is in positive territory, with a sharp negative slope approaching the midline. Meanwhile, the MACD (Moving Average Convergence Divergence) prints soft red bars.
Resistance levels: 182.05 (20-day Simple Moving Average), 183.00, 184.00.
Support levels: 180.00. 179.50, 179.00.
Technical Levels: Supports and Resistances
GBPJPY currently trading at 181.38 at the time of writing. Pair opened at 182.25 and is trading with a change of -0.48 % .
| Overview | Overview.1 | |
|---|---|---|
| 0 | Today last price | 181.38 |
| 1 | Today Daily Change | -0.87 |
| 2 | Today Daily Change % | -0.48 |
| 3 | Today daily open | 182.25 |
The pair is trading below its 20 Daily moving average @ 182.17, above its 50 Daily moving average @ 178.03 , above its 100 Daily moving average @ 171.65 and above its 200 Daily moving average @ 167.62
| Trends | Trends.1 | |
|---|---|---|
| 0 | Daily SMA20 | 182.17 |
| 1 | Daily SMA50 | 178.03 |
| 2 | Daily SMA100 | 171.65 |
| 3 | Daily SMA200 | 167.62 |
The previous day high was 182.53 while the previous day low was 179.92. The daily 38.2% Fib levels comes at 181.53, expected to provide resistance. Similarly, the daily 61.8% fib level is at 180.92, expected to provide support.
Note the levels of interest below:
- Pivot support is noted at 180.6, 178.95, 177.99
- Pivot resistance is noted at 183.22, 184.18, 185.83
| Levels | Levels.1 |
|---|---|
| Previous Daily High | 182.53 |
| Previous Daily Low | 179.92 |
| Previous Weekly High | 182.53 |
| Previous Weekly Low | 179.74 |
| Previous Monthly High | 183.88 |
| Previous Monthly Low | 172.67 |
| Daily Fibonacci 38.2% | 181.53 |
| Daily Fibonacci 61.8% | 180.92 |
| Daily Pivot Point S1 | 180.60 |
| Daily Pivot Point S2 | 178.95 |
| Daily Pivot Point S3 | 177.99 |
| Daily Pivot Point R1 | 183.22 |
| Daily Pivot Point R2 | 184.18 |
| Daily Pivot Point R3 | 185.83 |
[/s2If]
Download Nehcap EAWe have two EAs that are operational on our LIVE accounts.
- EA-FIX: Check out the details here. Download EA-FIX . EA-FIX is a non-grid HFT scalper.
- EA-GROWTH: High quality low dd EA using trend grids. Download EA_GROWTHJoin Our Telegram Group
")


