If the USDCHF pair manages to reach the May 4th daily low of 0.8819, which also coincides with the 61.8% Fibonacci retracement level, it may transition to a neutral stance.
…
This is a premium post.
[s2If !current_user_can(access_s2member_level4)]Please register for FREE REGISTER to read full post below containing analysis. In case of any error or you think you are not able to read the full post below, please email us at support#nehcap.com [lwa][/s2If] [s2If current_user_can(access_s2member_level1)]
- The USD/CHF could shift to a neutral bias if it reclaims the May 4 daily low of 0.8819, which converges with the 61.8% Fibonacci (Fibo) retracement level.
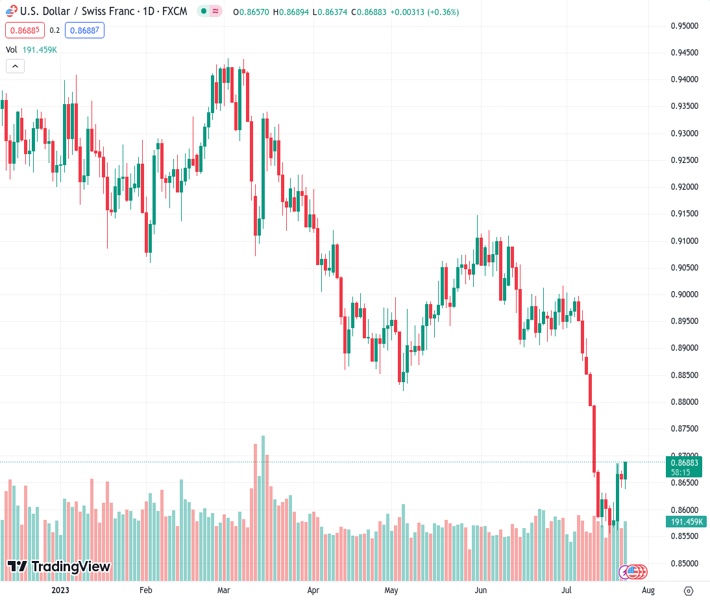
The pair currently trades last at 0.86874.
The previous day high was 0.8672 while the previous day low was 0.8641. The daily 38.2% Fib levels comes at 0.8653, expected to provide support. Similarly, the daily 61.8% fib level is at 0.866, expected to provide support.
USD/CHF rebounds from last Friday’s lows of 0.8640 and climbs on a strong US Dollar (USD) amid a risk-on impulse as Wall Street prints solid gains. The USD/CHF is trading at 0.8683, gains 0.31%, after hitting low of 0.8637.
The USD/CHF is yet to turn neutral, even though it recovered some ground during the last three trading days, with the pair gaining 1.50%. Should be said, the USD/CHF could shift its bias to neutral if it reclaims the May 4 daily low of 0.8819, confluence with the 61.8% Fibonacci (Fibo) retracement.
If that ceiling level is broken, the next resistance would emerge at the next confluence of the 50-day EMA and the 78.6% Fibo level at 0.8875/0.8900 area, followed by the 0.9000 mark.
Nevertheless, the USD/CHF path of least resistance is downwards and will resume its downtrend once sellers drag prices below the 23.6% Fibo retracement at 0.8659. On further weakness, the USD/CHF could extend its losses past the 0.8600 figure, followed by the year-to-date (YTD) Low of 0.8554.
From an oscillator standpoint, the Relative Strength Index (RSI), aiming upwards, suggests the USD/CHF upward correction could continue, but as it remains in bearish territory, once turning flat, could pave the way for a reversal. Contrarily, the three-day Rate of Change (RoC) portrays buyers entering the market. That said, mixed signals could refrain USD/CHF traders from opening fresh positions ahead of the FOMC’s meeting.
Technical Levels: Supports and Resistances
USDCHF currently trading at 0.8687 at the time of writing. Pair opened at 0.8656 and is trading with a change of 0.36 % .
| Overview | Overview.1 | |
|---|---|---|
| 0 | Today last price | 0.8687 |
| 1 | Today Daily Change | 0.0031 |
| 2 | Today Daily Change % | 0.3600 |
| 3 | Today daily open | 0.8656 |
The pair remains strongly bearish on the daily time frame. It trades below the 20 SMA @ 0.881, 50 SMA 0.8934, 100 SMA @ 0.9002 and 200 SMA @ 0.9218.
| Trends | Trends.1 | |
|---|---|---|
| 0 | Daily SMA20 | 0.8810 |
| 1 | Daily SMA50 | 0.8934 |
| 2 | Daily SMA100 | 0.9002 |
| 3 | Daily SMA200 | 0.9218 |
The previous day high was 0.8672 while the previous day low was 0.8641. The daily 38.2% Fib levels comes at 0.8653, expected to provide support. Similarly, the daily 61.8% fib level is at 0.866, expected to provide support.
Note the levels of interest below:
- Pivot support is noted at 0.864, 0.8625, 0.8609
- Pivot resistance is noted at 0.8672, 0.8688, 0.8704
| Levels | Levels.1 |
|---|---|
| Previous Daily High | 0.8672 |
| Previous Daily Low | 0.8641 |
| Previous Weekly High | 0.8684 |
| Previous Weekly Low | 0.8555 |
| Previous Monthly High | 0.9120 |
| Previous Monthly Low | 0.8902 |
| Daily Fibonacci 38.2% | 0.8653 |
| Daily Fibonacci 61.8% | 0.8660 |
| Daily Pivot Point S1 | 0.8640 |
| Daily Pivot Point S2 | 0.8625 |
| Daily Pivot Point S3 | 0.8609 |
| Daily Pivot Point R1 | 0.8672 |
| Daily Pivot Point R2 | 0.8688 |
| Daily Pivot Point R3 | 0.8704 |
[/s2If]
Download Nehcap EAWe have two EAs that are operational on our LIVE accounts.
- EA-FIX: Check out the details here. Download EA-FIX . EA-FIX is a non-grid HFT scalper.
- EA-GROWTH: High quality low dd EA using trend grids. Download EA_GROWTHJoin Our Telegram Group
")


